Quantcast
Channel: arduino for visual studio
Viewing all 226 articles
Browse latest View live

16 - Configure debug for other types of serial transport (APM or SoftwareSerial)

$
0
0

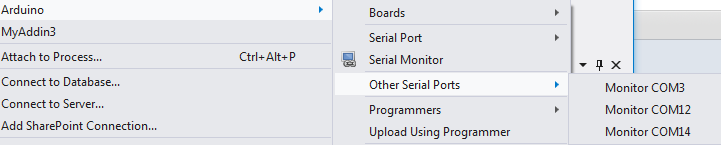
It is possible to use Arduino SoftwareSerial or APM FastSerial with the debugger. The SoftwareSerial library is automatically included duiring compilation but to use FastSerial you must be debugging an Arduino project that includes references to FastSerial (such as ArduPilot and ArduCopter)

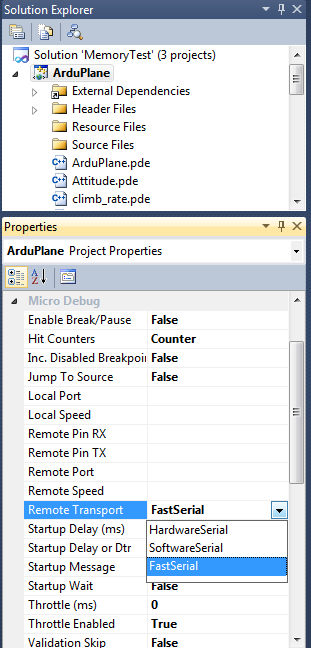
As an APM user, the "RemoteTransport" project property will be something you WILL need to set. Other users are not concerned with "RemoteTransport" because the default uses normal arduino hardware serial. Anyway, it's easy to setup because the options have a pick list (see below).

All of the options shown below are default except for the FastSerial setting. The configuration below will result in FastSerial on the APM upload port at a speed of 115200 baud. So, with this configuration, you can not use mission planner unless it is connected via xbee.

click the image for a draft overview tutorial

Tips...

  • To use a different APM serial port such as Serial2, enter Serial2 as the "RemotePort" property
  • To use a different PC serial port such as COM7, enter COM7 as the "LocalPort" property
  • To switch from the default speed of 115200, set the "LocalSpeed" to value from the pick list, RemoteSpeed will change automatically to match.
  • Apm users should not that the "Throttle" properties relate to debugger bandwidth throttling and are nothing to do with drones :) Leave the throttle at the defaults, learn more about the throttle via the forum.
  • If using SoftwareSerial on spare digital pins you should clear the RemotePort property and set the Remote Rx Tx Pins to the digital pins that are connected to the serial device or cable. If "Break/Pause" and "Startup Wait" are not enabled (default) then only the Arduino Tx pin is required

And a few hints that might mean something at some stage...

1) Validation Skip (project property) 

Set to False if you are not altering the arduino code in a way that might cause compilation errors. This will skip the "release" build of apm that happens prior to the debug build. (Saves time)

2) TracePoint Throttle (project property)

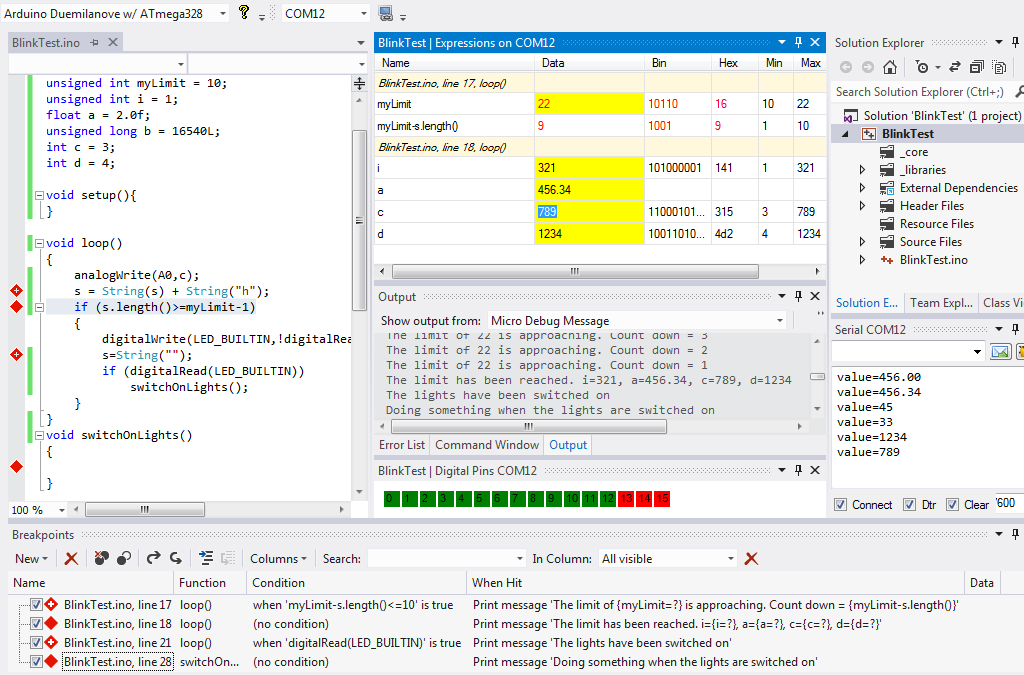
An unconditional breakpoint/tracepoint example in the 50hz loop is a good example for us to use...

By default, for newer users and non fastserial users the breakpoints are throttled so that the 50hz loop will only run at about 8-12hz. Visual micro ensures an 80 millisecond delay between breakpoints. 

a)
FastSerial is more efficient than normal arduino serial so you could change the project property called Throttle (ms) to, for example, 30 (milllis) which would improve the speed. Leaving the Throttle (ms) empty uses the default of 80ms.

or b)
Try setting "Throttle Enabled = False" to entirely disable throttling in which case apm will send as fast as it can but it is possible for the arduino buffer to overflow causing the debug to stop working or invalid serial packets to be received by the debugger

or c)
Set the breakpoint "HitCount" to 50. Because we are in the 50hz loop this should produce one debug breakpoint message every second allowing apm to function at full speed inbetween each breakpoint message

or d)
Set the "Hit Counter" project property to milliseconds and all the breakpoint "HitCounters" will no longer be treated as counts, instead the HitCounts will represent milliseconds. So a breakpoint "HitCount" of 1000 would produce a debug  message exactly once every second regardless of where you put the breakpoint.

IMPORTANT NOTES 

When sharing the serial port with the arduino code you might expect to see some "junk" in the serial window. This is normal, the debugger windows will workaround the "junk" and function correctly. If your arduino program reads the serial port then you will not be able to switch on the break/pause facility in which case you should use a different arduino serial port or SoftwareSerial on two digital pins.

The throttle setting is very dependant on the speed of your pc. If the arduino sends messages faster than your pc can process them the pc display will fall behind the arduino. The pc display will no longer be real-time and will be confusing.


Arduino Debug Release Information - Breakpoints Example

$
0
0

The Arduino debugger upgrade for Visual Studio is due for release in June 2012. The date has slipped slightly due to high work loads. The debugger includes eveything required to set conditional breakpoints, trace messages, expression reporting step through pre-defined debug points. The Arduino debug tool does not require you to make any code modifications to your arduino source code so it is fully automated.

In the Arduino breakpoints below we see 5 breakpoints of various types. Two breakpoints have conditional expressions, one breakpoint produces a trace message and also reports the value of variable i. An unlimited number of Arduino variables to watch can be set per breakpoint, the message is also optional. Two breakpoints have hit conditions (n times before each hit)

Read more about the Arduino Debug Tool

Please EMAIL beta @ visualmicro.com if you would like to be a beta tester

Use Or Reference Arduino Code Syntax In C C Cpp H

$
0
0

When C++ files are used in an Arduino project the Arduino core is not automatically available to the source code, as it is with .pde/ino files. This document describes how to include the Arduino core manually in c++ files.

The following code example is how to include the correct Arduino core header and also to provide access to Arduino Serial functions from mycode.cpp and mycode.h files:-

mycode.c or mycode.cpp:-

#if defined(ARDUINO) && (ARDUINO >= 100)
#include "Arduino.h"
#else
#include "WProgram.h"
#endif
#include "HardwareSerial.h"
#include "myc.h"

mycode.h:-

#if defined(ARDUINO) && ARDUINO >= 100
#include "Arduino.h"
#else
#include "WProgram.h"
#endif
#include "HardwareSerial.h"
#include "myc.h"

Tip: All arduino versions 1.0 and above have a version >= 100. Example: Arduino 1.0.1 has a version of 101.

How to - Arduino code syntax in c++ (.c. cpp .h)?

$
0
0

We often want to structure the code in our Arduino projects to keep it simple and organised. The Arduino system allows us to create two main types of source files. The first type of source file are the "standard" Arduino source files. These standard files have a .pde or .ino extension and are, behind the scenes, automatically combined into a single file during program compilation. This provides some advantages in terms of simplicity but is not as flexible as using standard C/C++ soure files.

The second type of file are normal C++ files. In Visual Studio it is possible to add C++ files to Arduino projects using the built in menu commands or the additional Arduino "quick insert" commands shown on the "Add New Item" button on the toolbar. The quick insert creates either a .c or a .cpp files and a .h file.

When c++ files are used in an Arduino project the Arduino core is not automatically available to the source code, as it is with .pde/ino files. However, the Arduino core can be included in various ways one of which is described below:-

If you look in "[arduinoide folder]/hardware/arduino/cores/arduino" you will see the arduino core files for include ideas such as hardwareserial.h, string.h or avr/pgmspace.h. HardwareSerial.h provides access to the Arduino serial commands that are normally available in a .pde or ino files.

In Arduino IDE version 1.0 and above the main Arduino program include is "Arduino.h", in older versions it is "WProgram.h". If required we can use the automatically defined ARDUINO constant to check for and use the correct include based on the current Arduino IDE version.

The following code example is how to include the correct Arduino core header and also to provide access to Arduino Serial functions from mycode.cpp and mycode.h files:-

mycode.c or mycode.cpp:-

#if defined(ARDUINO) && (ARDUINO >= 100)
#include "Arduino.h"
#else
#include "WProgram.h"
#endif
#include "HardwareSerial.h"
#include "myc.h"

mycode.h:-

#if defined(ARDUINO) && ARDUINO >= 100
#include "Arduino.h"
#else
#include "WProgram.h"
#endif
#include "HardwareSerial.h"
#include "myc.h"

Tip: All arduino versions 1.0 and above have a version greater than or equal to 100

Arduino Leonardo - Windows Hardware USB Installation Guide

$
0
0

Windows (tested on XP and 7)

The process for Windows XP and Windows 7 is similar. These screenshots are from an XP installation.

  • Plug in your board and wait for Windows to begin its driver installation process. If the installer does not launch automatically, Navigate to the Windows Device Manager (Start>Control Panel>Hardware) and find the Arduino Leonardo listing. Right click and choose Update driver.
  • If prompted to search for drivers online, choose "No, not this time". And click Next

Arduino Leonardo Windows Driver Installation - 1

  • When asked to install automatically or from a specific location, select "Install from a list or specific location" and press Next
Arduino Leonardo Windows Driver Installation - 2
  • Choose "Search for the best driver in these locations", and check the box "incude this location in the search". Click the Browse button and navigate to your Arduino 1.0.1 or later installation. Select the drivers folder an click OK
Arduino Leonardo Windows Driver Installation - 3
  • Click Next
  • You will receive a notification that the Leonardo has not passed Windows Logo testing. Click on the button Continue Anyway
Arduino Leonardo Windows Driver Installation - 4
  • After a few moments, a window will tell you the wizard has finished installing software for Arduino Leonardo. Press the Finish button

Original article found on arduino.cc


Arduino Leonardo Upload Differences

$
0
0

The Arduino Leonardo is a usb device that works in a different way to older or existing Arduino hardware. When a Leonardo starts it breifly appears in programming mode on a different serial port to the one it normally uses.

When an Arduino upload request begins the specified Leonardo serial port is polled at 1200 baud causing the Leonardo to reset. If the port is not found, both the Arduino and Visual Studio IDEs assume that the Leonardo has been reset or was resetting/starting and skip the attempt to reset.

Both Visual Studio and the Arduino IDE, scan to detect the new programming port appearing in the computers serial ports list which indicates a Leonardo startup has been detected. If a new port is not detected then both IDEs' will wait for 5 seconds (on windows) before raising the error:- "Couldn’t find a Leonardo on the selected port. Check that you have the correct port selected. If it is correct, try pressing the board's reset button after initiating the upload."

On Microsoft windows, once the upload has completed, there is a 0.5 sec pause to ensure the Leonardo has re-booted and that the original serial port has re-connected.

After upload, Visual Studio confirms the actual upload port to the user using the "Sketch Output" tab. An example Leonardo upload message is shown below. Notice the switch from Leonardo serial COM37 to COM38

Compiling 'MySensor' for 'Arduino Leonardo'

Binary sketch size: 4844 bytes (of a 28672 byte maximum) (0.507 secs)

Uploading to I/O board using 'COM37'

Done uploading via 'COM38'


This document is a result of reading the source code for the arduino ide provided by arduino.cc

Arduino avrdude upload error common causes

$
0
0

Generally there are only a few reasons for avrdude upload errors during arduino serial/bootloader uploads:-

  • The wrong serial port is selected. Answer - Select the correct serial port from the serial ports list
  • The wrong Arduino board is selected. Answer - Select the correct board from the Arduino boards list
  • Tools>Upload using Programmer is incorrectly ticked. Answer - Untick the menu item

Arduino Upload Error Example

Uploading to I/O board using 'COM37'

avrdude: Version 5.11, compiled on Sep 2 2011 at 19:38:36

Copyright (c) 2000-2005 Brian Dean, http://www.bdmicro.com/

Copyright (c) 2007-2009 Joerg Wunsch

[more detail...]

In what order does Arduino combine sketch files (pde/ino) during compilation?

$
0
0

During compilation Arduino sorts (sequences) the sketch files as follows:-

  1. Main sketch file is always first
  2. Followed by sort based on alpha char codes

This is a correct example for sketch 'MySketch.ino' :-

  1. MySketch.ino
  2. AFile1.ino
  3. BFile2.ino
  4. aFile3.ino
  5. bFile4.ini

The release of visual micro due end of july 2012 applies the above order. Previously releases always ensured the man sketch was first but then incorrectly applied a standard alpha sort which resulted in an incorrect sequence as shown below:-

  1. MySketch.ino
  2. AFile1.ino
  3. aFile2.ino
  4. BFile3.ino
  5. bFile4.ini

The Visual Micro Extensibility Framework

$
0
0

Aug 2012: First draft, pre-release - About The Visual Micro Extension Framework

Debugger visualizations are controls and/or windows written in any .NET language that enable us to graphically display remote debug data from a micro-controller such as an arduino. This means that any open source .net instrument/control project that can be found on the internet can be used as a visualization. The micro extension framework is a set of easy to implement inheritable classes that enable an application to interact with the arduino debugger and also with visual studio. Visualizations are loaded with full trust and have access to a computer in the same way that other visual studio addins can access a computer.

The Visual Micro inheritance system is optional, but provides an easy way to manage a debug state server. Below is an example of a >NET form constructor requesting notification of 3 visual micro debugger events. (OnDebugInit, OnDebugStateChanged, OnDataExpressionValuesChanged)

public SketchDebuggerExample1Window()
{
InitializeComponent(); //standard vs component init

  • this.OnDebugInit += onDebugInit; //fires when debug is started before connect to micro
  • this.OnDebugStateChanged += onDebugStateChanged; //fires whenever a debug state change occurrs
  • this.OnDataExpressionValuesChanged += onExpressionValuesChanged; //fires when a watched expression breakpoint is hit

}

Event sigantures

  • void onDebugInit(object sender, DebugInitEventArgs e)
  • void onExpressionValuesChanged(object sender, ExpressionValuesChangedArgs e)
  • void onDebugStateChanged(object sender, DebugStateChangedArgs e)

The Visual Micro debug upgrade is supplied with a few basic working examples such as Digital Pin Viewer, Analog Graphs and other examples, found on the internet and adapted to be intelligent visualizations. All of the example are supplied with full source, attributed to the original authors, and may be feely copied or extended.

Visualizations are therefore simply just .NET dll(s) and all that is needed to register them into Visual Micro is a MicroExtension.xml file. The xml file provides a unique name for the visualization, a caption, path to the dll and namespace.className of the control to be loaded. The file also allows "Watched" expressions "of interest" to be registered and setting of the "Startup" type.

"StartUp" types include:-

  • open when watched expression is hit
  • open when debug starts
  • open when user demands

The captions of all open/running Visualizations will appear on the "Running Visualizations" menu of the debug button in the serial tool window. This menu item allows us to hide/show active visualizations for the current project. (Settings are retained after vs closes)

The captions of any "When User Demands" visualizations will appear on the "Other Windows" menu of the the debug button in the serial tool window. This menu allows us to enable/disable a visualization for the current project. (settings are retained after vs closes)

Visualizations can be placed in specific folders in any one of three locations. Under the vm program folder, under My Document, under a sketch folder. The latter being specific visualizations for a single sketch project.

To create a visualization we create a normal .net class project and set the COM Visible property to true (Project>Properties>Build>Assembly>Com Visible checkbox. Adding a UserControl or Form to the class project and inheriting MicroDebugDataVisualizationWindowBase or MicroDebugDataVisualizationControlBase

To gain access to these inheritable classes the project must contain a reference to Visual.Micro.Debugger.Data.Extensions" assembly that is available in the global assemblies list. Tip: Right click the project and select "Add Reference". Alternatively copy and rename one of the provided Visual Micro examples which will already be configured with the reference :)

  • using Visual.Micro.Debugger.Extensions
  • using Visual.Micro.Xml

The xml object is an optional helper, if you have experience with xml you might have a better solution.

If you copy an existing Visualization we must replace the projects "Assembly" guid with a new one. Create a new guid using Tools>Create Guid. Set the new guid against the project by right clicking the project and clicking the Advaned or Assembly button

Click to enlarge. Soon to be released open source debugger visualizations. Digital and analog visualizations are included with the debugger upgrade. Build visualizations using ANY data from an Arduino

How can we debug our visualizations

Currently, the controls shipped with visual micro are .NET3.5 format so that they work for both VS 2008 and 2010 users. If you are using VS2010 and want to debug a visualization it is recommended that you switch the .NET version (project properties) to 4.0. If you do not do this then you will not be able to use "Start>debugging" in your c# or vb projects. Instead you will have to use "Tools>Attach to process" once you have an Arduino sketch open in Visual Studio. "Start>debugging" is the recommended debug option because it will allow you to edit/change your code during an active debug session.

It gets a bit confusing because to debug your visualization you will have two debug sessions running in two different visual studio instances. One for your visualization and one for the arduino :) You should also bear in mind that if you havd a sloe machine or if you hit a breakpoint in your C#/Vb code the pc will fall behind realtime with the arduino. This is not a probleme except it might cause confusion. So after breaking into a visualization and fixing a bug, I suggest re-starting the debug session.

When you try to start>debug a class project in visual studio you may encounter a message telling you that class projects can't be debugged directly. Our extension is a Visual Studio plugin so we actually want to debug visual studio when it is running our extension.

To make the debug work correctly, right click the project and open the project properties window. Click the "Debug" tab and click the radio button called "Start external program:". Enter the full path to your visual studio program in the box. An example being "C:\Program Files (x86)\Microsoft Visual Studio 10.0\Common7\IDE\devenv.exe". On the same screen, set the "Working directory:" to the folder containing the devenv.exe, an example might be "C:\Program Files (x86)\Microsoft Visual Studio 10.0\Common7\IDE\"

Once you have set .NET4 and configured the options above you can switch the visualization project to "Debug" mode and press F5. This will start visual studio so you can open a sketch project that will use the visualization. Configure the sketch for "Full" debug and press F5 to start the arduino debugger. When the visualization opens in the arduino debugger your breakpoints should be hit in the visualization control debugger.

Important Point: When a visualization has been loaded into a tool window by an instance of visual studio, the visualization (dll) will not be unloaded/released until the Visual Studio instance exists. A hidden visual studio tool window is still open and available. You will not be able to re-compile the visualization while the assembly remains loaded into another visual studio instance

Configuration Settings

Whilst a visualization dll can not be re-loaded without re-starting visual studio it is possible to alter the settings in the MicroExtension.xml which is re-loaded each time the debugger starts. This also means that is is possible to add new extensions without re-starting visual studio, Visual Micro will auto detect new xml files each time the debugger starts.

The MicroExtension.xml file also provides the facility for "User Settings" allowing the visualization to dynamically render different graphics based upon xml properties. This means that a single visualization control can be highly customizable without the need to re-compile or re-build the visualization dll.

Below is an example of a very basic visualization. The project provides 3 cicular dial instrument controls (like speedometers). When the arduino debug starts the visualization is notified and is also provided with the xml object of the MicroExtension.xml along with simple functions to provide the xml data to the c#/vb code.

The c#/vb visualization example responds to the visual micro "OnDebugInit" event and initializes its graphical controls based upon the xml properties. This means that you can create a flexible visualization control that can be used in different ways by different people or in different projects.

In the xml example below the xml is a know visual micro structure except for "ConfigSettings". This section(s) is entirely user defined but it is hoped we find and agree a standard that we can all work with.

The ConfigSettings section can be accessed in c#/vb as follows:-

  • XmlNode ConfigSettingSensor1;
  • ConfigSettingSensor1 = MicroGetVisualizationConfigSetting("Sensor1");
  • ValueExpressionNameSensor1 = XmlHelper.GetAttribute(ConfigSettingSensor1, "ValueExpressionName")

MicroExtension.Xml example follows

<MicroDebugExtension Startup="WhenHit"
Name="SketchDebugExtension1"
Caption="Sketch Debug Example 1"
Enabled="1">

<Visualization Type="ToolWindow" 
AssemblyName="bin/SketchDebuggerExample1.dll"
FullTypeName="VisualizationExamples.SketchDebuggerExample1Window"
Startup="WhenHit">
<Watch>
<Expressions>
<Expression Name="ValueOfDial1">analogReadingA</Expression>
<Expression Name="ValueOfDial2">analogReadingB</Expression>
</Expressions>
</Watch>

<ConfigSettings Name="Standard">
<ConfigSetting Name="Page"
FontSize="12pt"
/>
<ConfigSetting Name="Sensor1"
DialText="Something 1"
MinValue="0"
MaxValue="1100"
NoOfDivisions="11"
NoOfSubDivisions="5"
ValueExpressionName="ValueOfDial1"/>
<ConfigSetting Name="Sensor2"
DialText="Something 2"
DialColor="Green"
MinValue="0"
MaxValue="1200"
NoOfDivisions="12"
NoOfSubDivisions="5"
ValueExpressionName="ValueOfDial2"
/>
<ConfigSetting Name="Sensor3"
DialText="Something 3"
MinValue="0"
MaxValue="1200"
NoOfDivisions="12"
NoOfSubDivisions="10"
DialColor="Yellow"
ValueExpression="ValueOfDial3"
/>

</ConfigSettings>

</Visualization>
</MicroDebugExtension>

Arduino Debugger Extensibility Performance Considerations

$
0
0

Aug 2012: First draft, pre-release - The Visual Micro Extension Framework

Visualizations provide a simple way to build powerful fully featured graphical plugins. It is possible to code both efficient and inefficient visualizations, the latter should be void!

Unfortuately all this power and flexiblity means that it is possible to create unwieldy and slow plugins that consume fast amounts of cpu power. This document provides a place to develop useful tips and suggestions that will help ensure the debugger continues to run at an efficient speed.

The Visual Micro interface provides a number of standard events that should be used to perform a little work as possible. For example in the OnDebugInit event is called once each time a debug session starts. The event should be used to initialise as much as possibly ensuring that a timer is used when possibly to prevent blocking.

The OnDebugExpressionsChanged event is called every time a breakpoint is hit. It is a high volume message and should be used to perform as little work as possible. Off-loading heavy processing to a regulated timer using a flag is highly recommended.

This OnDebugExpressionsChanged event also procides access to the dynamic xml properties from the MicroExtensions.xml config file. Looking up xml poperties is relatively heavy on cpu load as opposed to using class variables to store property settings. For this reason it is recommended that the OnDebugExpressionsChanged event is used to copy regularly used xml config properties into class variables. This will enable functions that are called regularly during a debug session to refer to the class properties and NOT the xml config properties.

When developing .NET visualizations (UserControls and Forms) testing using the slowest possible pc is highly recommended. A good target to aim for seems to be no more than a 3% increase in cpu load on a 1.8Ghz intel processor.

You can easily test the load your extension causes by adding a "Pause" checkbox to your control or form. Stop responding to the OnDebugExpressionValuesChanged event when the checkbox is true. Start a debug session and add a breakpoint that your visualization is watching for intoto the loop().  This causes a huge amount of debug messages to be sent to the pc. Clikcing the Pause checkbox should clearly show in windows task manager the additional cpu load.

Arduino - Learning by Example using Visual Studio and APM

$
0
0

Selecting an Arduino development tool that provides code assistance is a big help for new arduino users and also to users who are new to a particular arduino program. Features that can be very useful are:- help, examples, code completion, error correction and intellisense.

Help and Examples

Arduino provides a number of examples to help us understand the basics of micro-controller development. Many arduino libraries, created by the community, are also provided with examples.

The "File" menu in the Arduino IDE provides access to all of these examples. In the Arduino IDE we click an example to open it as a new sketch project. In the Arduino IDE, that editing and saving the example will be replaced with modified code. In Visual Studio we get to choose if we would like to create a copy of an example or use the original. We also get a few others options described later on in this page.

Examples are a useful facility and are often overlooked by new users. Examples help us understand the core components of any arduino project. By understanding the core components such as sensors and servos we are able to then create or understand larger Arduino programs.

A good "example" being the ArduPilotMega (APM) drone project. This project has resulted in a few massive but highly crafted arduino programs such as ArduPilot and ArduCopter. The APM hardware involves sensors such as 3 axis:- giro, accelerometer, compass and a gps. The hardware can also drive servos or electronic speed controllers (esc) for rc cars, planes, copters and boards. The heart of the APM circuit board is a standard Arduino micro-processor with some additional sensors ++.

Micro explorer showing apm examples and error correction

At this point I should add that there are other drone projects that use a variety of other arduino based solutions, I am not recomending which is the best I am simply using APM as an example. A reason for using APM as an example is that the project is so incredibly well written, it is an enourmous project that has been re-worked almost to perfection (from an arduino programming point of view!). The code is well formatted, the program is very flexible and can optionally include a large number of different types of sensors (and options). 

A great benfit for new APM users are the examples provided by the diydrones.com community. Every variation of every sensor supported by diydrones.com programs written for APM is available as an example. This makes it possible to write small simple experimental programs or use the examples as they are. These small programs are a great wayt to understand how each sensor, servo, motor, esc, etc. works.

The Visual Studio Arduino plugin provides the micro explorer tool  (shown above) includes these examples but also other reference and tutorials.  The explorer allows arduino examples to be opened, new arduino projects to created from examples and/or to simply open individual example sources for inspection (or copy/paste).

The explorer provides the same refererence examples that are available in the arduino ide with the addition of advanced references for the AVR microcontroller and gcc compiler. The latter being useful for more advanced users. A custom google search facility fixed to arduino.cc, arduino wiki, arduino forum and visualmicro.com provides a "www search" without leaving the Visual Studio development tool.

Arduino Code Completion and Intellisense

In the picture below you can see the micro explorer tool providing a drill down into the APM/Arduino example sources. The image also includes source code with an inteltional error to demonstrate Arduino code completion and error correction in Visual Studio.

Pressing the '.' (full stop) automatically displays a list of available members of the object called g in the ArduPilot project. Pressing F12 will goto the definition of an item. SHIFT+F12 will find all references to the currently selected code. All these functions and more are on right click menus and the menus at the top of visual studio.

How to explorer an arduino project using Visual Studio intellisense

References

Microsoft Visual Studio Profressional is available for 3 years free (if you are an individual and not a professional web designer or working for a web design company)

The Visual Micro plugin for Visual Studio can be downloaded for free from www.visualmicro.com

Arduino - Memory Usage and Disassembly Reporting

$
0
0

The August 2012 release of the Arduino plugin for Visual Studio provides useful options to display memory usage and program disassembly reports as part of the Arduino compile process. The disassembly view might not be useful for arduino beginners but the memory usage report might be espcially useful for beginners.

Arduino processors have a relatively small amount of "running" data memory which is often quickly consumed by new users adding their own debug messages to arduino programs. Arduino debug messages are often serial messages such as:- Serial.println("Hello World, I am here at this place in my code!")

Long serial text messages like the one above will quickly fill up the arduino memory which might only be 2048 bytes (characters). Serial messages are just one example of memory consumption. If the Arduino attempts to overflow the available memory it will crash (freeze). A crash is both difficult to debug and also can be quite disasterous so best avoided!

It is true that the arduino has other small memory areas where data could be stored. The other memory areas are for another article and do not remove the need to monitor memory usage.

Arduino Memory Usage Report

The memory uage report is enabled using the visual studio project properties window as shown below. The properties window is displayed by selecting the project node in the viual studio solution explorer and pressing F4 (or "View>Properties Window")

How to enable Arduino memory and disassembly reporting

The arduino memory usage report is automatically displayed after each compile in the "Micro Build" output window shown below. The report shows memory usage after compilation.

NB: The memory usage report does not show the dynamic memory that might be allocated by an arduino program after it has started running on an arduino chip. Dynamic memory can be reported in visual studio using the visual micro debug upgrade or by adding code to your arduino program. See this reference for more info.

Arduino Program Disassembly Report

The disassembly view takes arduino learning to the next level or provides useful information for experienced arduino programers. The disassembly view is automatically displayed in the "Micro Disassembly" output window after each compile (see top picture of how to enable disassembly reports). Below you can see an exampe of the disassembly of the diydrones ArduPilot program

References

Microsoft Visual Studio Profressional is available for 3 years free (if you are an individual and not a professional web designer or working for a web design company)

The Visual Micro plugin for Visual Studio can be downloaded for free from www.visualmicro.com

Automate the Arduino IDE for Visual Studio Interface

$
0
0

We can build our own tool bar layouts or add shortcuts to frequently used Arduino commands to the Visual Studio user interface.

How To

Right click any Visual Studio tool strip and select "Customize" which will on the bottom of the right mouse menu.

When the Customize window opens (see below), click keyboard to assign shortcut keys. Click the  "Commands" tab to add commands to menus and tool bars.

When adding a command or shortcut the Visual Micro commands will be displayed under the "Addins" section 

Below you can see the possibility to add Arduino commands such as board selection to the "File" menu.

...

Warning: On rare occassions Visual Studio becomes confused and which causes visual micro menus and tool bar controls to disappear. The documented solution for this problem is to use the visual studio resetaddin command. Running this command will remove any customizations you have made that reference visual.micro macros. I am not currently sure if it is possible to backup your customizations of the visual studio ide. The safest way to work might be to create a visual studio macro that creates the arduino buttons, shortcuts and menus based on visual micro micros. Doing so allows you to re-run your macro and re-create your customizations at any time in the future.

A guide to installing new non-arduino hardware or custom arduino cores

$
0
0

A guide to installing new non-arduino hardware or custom arduino cores

...


Arduino allows new non-arduino hardware to be installed to the arduino ex folder or to the arduino sketchbook folder.

Adding new hardware cores and libraries to your "Sketch Book Folder" is probably the best way to work because it means that you don't have to re-install the new hardware each time you upgrade to a new Arduino IDE.

For the purposes of this demonstration we are using "avr-netino". The image below shows a successful compile of the 4 example projects in the avr-netino-19Jan2012.zip on google code.

I am currently running Visual Studio and arduino 1.0.1, but I think it will work the same for arduino 1.0. 

These are the steps I made to install this new hardware and associated files.

Overview

The zip contains 3 folders. Hardware, Libraries and Examples

Installation

1) Copy the contents of the "Hardware" folder to your "[Sketch Book Folder]\Hardware" folder. 
Nb: Create the Hardware folder if it does not exist

2) Copy the contents of the "Libraries" folder to "[Sketch Book Folder]\Libraries"
Nb: Create the Libraries folder if it does not exist.

3) Copy the "avr-netino" folder from the "examples" in the zip to the sketch book folder.

The location of your sketch book folder can be found in the Arduino ide "File>Preferences" window or by selecting "File>Open Arduino File" in Visual Studio. My sketch book folder is "My Documents\Arduino"

Re-start Visual Studio and you should see the new hardware on the boards list. Both Visual Studio and Arduino should compile correctly with this configuration.

Customize Visual Studio Using Arduino Macros

$
0
0

The Arduino plugin for Visual Studio automatically creates a Visual Studio macro for every Arduino command. This enables us to add Arduino commands to menus and tool bars. It also allows us to assign shortbut keys to all of the Arduino commands.

Clicking "Customize>Add Command>Addins" on any Visual Studio tool bar or within the menus provides a list of "Visual.Micro" commands as shown below

The following image shows a button that, when clicked, quickly selects a specific Arduino board. In this case a custom board is being selected hence the strange name.

Warning: On rare occassions Visual Studio becomes confused and which causes visual micro menus and tool bar controls to disappear. The documented solution for this problem is to use the visual studio resetaddin command. Running this command will remove any customizations you have made that reference visual.micro macros. I am not currently sure if it is possible to backup your customizations of the visual studio ide. The safest way to work might be to create a visual studio macro that creates the arduino buttons, shortcuts and menus based on visual micro micros. Doing so allows you to re-run your macro and re-create your customizations at any time in the future.


Modify Arduino Variables During a Debug Session

$
0
0

Draft Documentation

Thanks to the collaboration, C++ skill and ideas of Heinz Kessler I am pleased to announce availability of the facility to change Arduino variables during an Arduino debug session. At the end of this document you can read some additional useful information that Heinz has provided.

Previously we were able to read and debug any Arduino expression. Now we can send data to the Arduino and change the value of variables without writing any code or re-compiling.

To configure a variable to be read/write we append "=?" to a variable name in a breakpoint "WhenHit" message. For example, {myVar} becomes {myVar=?}. Variables that can be altered during a debug session will show in the watch window with yellow background (see below)

Click the image to enlarge. notice that the values of all variables have been altered from the original compiled arduino source code. This is just an example, it is not recommended to place breakpoints without condition because, by default, it slows the Arduino down.

Update Arduino MCU Variables During A Debug Session

note: the message viewer in the image above was frozen at an informative position for the purposes of this example. The code in the example is the entire arduino program code.

The debugger supports two different modes that allow variables to be updated. It is important to understand the difference between the two modes:-

Mode 1) Debug with "Enable Break/Pause=False" - Arduino does not stop

In this mode we can alter any of the assigned writable variables at any time however the change in value will only be recognised when the BreaPoint/TracePoint is hit/passed. The order that variables are updated corresponds to the order that you update them. For example if you update var1 which is in a breakpoint hit every 10 minutes then no other updates will be applied to any other variables until the 10 minutes has been reached.

If you are updating variables in a fast loop() then, subject to your code, the updates should also be applied immediately.

Mode 2) Debug with "Enable Break/Pause=True" and "WhenHit Continue Execution = False" - Arduino stops and waits for F5/Continue

In this mode only the variables of the current breakpoint can be changed.

With the mouse, select and hover over a breakpoint in the expression window to see information about the breakpoint

In the image below the breakpoint configuration specifies variables 'i' and 'a' to be read/write and 'c' is read-only. This configuration is specified using the "WhenHit" property of the breakpoint. 

Update Arduino MCU Variables During A Debug Session

General Debug Reminder

Additional messages can be mixed with variables in the "Breakpoint WhenHit" property.

For example a breakpoint WhenHit message might be:-

Hello World, we can write to 'i' which currently equals {i=?} and also to 'a' which = {a=?} but 'c' is readonly and has a value of {c}

The message above automatically watches variables i,a and c.

Known Bugs or Quirks

Normal Arduino serial seems to work very well but if you are using the SoftwareSerial option then problems have been detected at speeds above 57600.

SoftwareSerial needs further investigation. If Break/Pause is enabled the first variable update failed in our tests but was reliable thereafter.

We are working on a more efficient version of the debugger which will use less Arduino memory. This probably applies more to the basic debugger than the code to set variable values/data. 

The current version incorrectly shows yellow background for all updateable variables of all breakpoints. The next release will show only yellow backgrounds for the current breakpoint.

When a variable value is changed the arduino (optional) confirms the new value in the serial window. However, the expression window will revert to the variables previous value until the breakpoint is next hit.

Options

By default, when a new variable value is recieved by the arduino a confirmation message is shown in the serial window of the active debugger. To disable this feature add this preprocessor directive to the visual micro project properties VM_DEBUG_WRITEVAR_CONFIRM=0

How Does It Work?

Heinz, was also first to notice that when specifying expression in the debugger we can optionally format the returned data using standard arduino data type specifiers such as "{myVar,HEX}" or "mySensorValue,BIN}". 

Heinz has incorporated this feature into the code that writes data back to the Arduino mcu variables, this means we can edit binary or hex values instead of plain numeric values.

In addition to all the standard numeric/int/float data types, Heinz has also catered for char * (max 40 bytes in length). This solution also ensures that requests to update readonly or invalid expressions are ignored gracefully. "char", "byte", "boolean" are all treated as 'char'. This means their values can be entered as integer instead of ASCII by using the DEC, HEX or BIN format specifier in the breakpoints, example: {c,DEC} or {vc,HEX}

Heinz has used C++ Templates to implement this feature 

template<typename T> void setVariable( T &i, int j );

template<typename T> void setVariable( T &i, byte format, int j );

template<typename T> void setVariable( T i, long j );

template<typename T> void setVariable( T i, byte format, long j );

The first two handle variables with or without format specifier (DEC, HEX and so on).

The second two handle non-variables (rvalues) like in this examples: {i+1=?} or {foo()=?}


NOTE: The code above is an example of the code that the debugger automatically uses when you debug an Arduino project. You do NOT need to add this code to any of your Arduino projects. The debugger is a codeless solution (except for your breakpoint conditions and expressions)


Example of an Arduino Debug Session in Visual Studio 2012 with breakpoint variables that can be modified, debug message output window and digital/analog visualizations

Update Arduino MCU Variables During A Debug Session


Disclaimer: This USB debug tool is provided without warranty or liability. Use this tool entirely at your own risk. The authors accept no liability for any damages caused to persons or property when using this tool or when using the programs that are created by this tool.


Visual Micro Published by Tim Leek

Alternative Serial Monitors - Arduino Project Settings Remain Unaffected

$
0
0

The standard "Serial Port" option for Arduino performs two functions. The first to set the upload port of the current project to the selected port, the second is to set the port that the "Serial Monitor" short cut buttons open.

The "Other Serial Ports" menu allows us to open any serial port monitor without changing the current projects upload settings. This is useful if we need to quickly monitor ports other than the port used for uploads without upsetting the current arduino projects' upload settings. 

As with all Visual Micro commands each of the available serial ports will be found in Visual Studio macro list and can be used to assign shortcut keys and quick access menus and buttons. Read more Customizing the Arduino IDE in Visual Studio

Tools>Arduino>Other Serial Ports>Minotor COM[n]

Monitor other serial ports without affecting the arduino upload settings

Other port monitors may still be opened on an Arduino upload port and will be automatically detected, closed and re-opened during upload to an arduino. In this respect they work the same way as the standard serial monitor.

How to disable auto update check for new plugin versions

$
0
0

As of 30th Dec 2012 the plugin checks for updates in the background. Your private information is not transmitted during the update check however you can disable the feature via "Tools>Options>Visual Micro>System"

Control Execution Speed With Hit Counters

$
0
0

The Arduino Debugger can be used in a more advanced mode allowing you more control over the frequency of Break and Trace control/messages. Keep in mind that behind the scenes this debugger uses serial messages. Allowing too many messages will cause either the arduino or your pc to loose or corrupt messages and a possible slow down of cpu(s).

Placing a trace point in a fast loop() would produce too many messages. For this reason Visual Micro throttles the messages and forces the arduino to slow down.

By default, Visual Micro imposes a wait of up to 80 milliseconds between breakpoints. This value can be altered using the project property called "Throttle (ms)". A value of 0 uses the current default which is 80 ms.

The Throttle is designed for new users and/or quick tests in applications that do not require the arduino to run at full speed (except for when transmitting a debugger message).

Using the Throttle is not the recommended solution!

Instead of using the Throttle, the debugger "Hit Count" facility should be used to "smooth" debugger breakpoints and/or tracepoint message. 

Depending on the frequency and position of your Arduino breakpoints you might want to ensure the Throttle is disabled. To do this you set the project property called "Throttle Enabled=False"

You will see on the options menu for each Breakpoint a menu item called "Hit Count". Normally in windows debugging the hit count is a count of how many times the point in the code has been hit. This is the same for Visual Micro except that a counter is often not very useful. Instead we can optionally switch from a count to a millisecond interval timer.

For example:- Setting the option "Break when hit is a multiple of x" to 200 would cause the arduino to break or trace when the code it hit every 200 times. However setting the project property called "Hit Counter" to milliseconds will cause the break/trace point to execute every 200 milliseconds.

Basic Hit Counter Information

Atomineer Pro Documentation

$
0
0

I like the Automineer documentation tool so I thought I would make a short post about it. Automineer works in Vs Pro and Atmel Studio and makes professional looking code documention very easy. 

Atomineer Pro Documentation for Visual Studio

  • Save time - save effort - save money.
  • Eliminate almost all the drudgery of filling in documentation.
  • Effortlessly keep code and documentation in sync.
  • Encourage better coding, naming and documentation practices.
  • Speed up development and reduce errors with intellisense help on all your own classes and methods.
  • Easily satisfy Code Analysis and Static Analysis requirements for documentation.
  • Accelerate editing of comments with formatting, word wrapping and bullet-list typing aids.

Documentation Xml

The default Atomineer style
  ////////////////////////////////////////////////////////////////////////////////////////////////////
  /// <summary> Tests skins. </summary>
  ///
  /// <remarks> Jason Williams, 23/04/2009. </remarks>
  ///
  /// <param name="exampleParam"> The example parameter. </param>
  ///
  /// <returns> true if the test passes, false if the test fails. </returns>
  ////////////////////////////////////////////////////////////////////////////////////////////////////

A compact style with no top/bottom separators or blank lines
  /// <summary>                    Tests skins. </summary>
  /// <remarks>                    Jason Williams, 23/04/2009. </remarks>
  /// <param name="exampleParam">  The example parameter. </param>
  /// <returns>                    true if the test passes, false if the test fails. </returns>

A Visual Basic compatible style
  '''-------------------------------------------------------------------------------------------------
  ''' <summary> Tests skins. </summary>
  '''
  ''' <remarks> Jason Williams, 23/04/2009. </remarks>
  '''
  ''' <param name="exampleParam"> The example parameter. </param>
  '''
  ''' <returns> true if the test passes, false if the test fails. </returns>
  '''-------------------------------------------------------------------------------------------------

Default style with entry padding and punctuation correction disabled.
  ////////////////////////////////////////////////////////////////////////////////////////////////////
  ///<summary>Tests skins</summary>
  ///
  ///<remarks>Jason Williams, 23/04/2009</remarks>
  ///
  ///<param name="exampleParam">The example parameter</param>
  ///
  ///<returns>true if the test passes, false if the test fails</returns>
  ////////////////////////////////////////////////////////////////////////////////////////////////////

User defined top/bottom separator lines
  ///------------------------------------------------------------------------------
  /// <summary> Tests skins. </summary>
  ///
  /// <remarks> Jason Williams, 23/04/2009. </remarks>
  ///
  /// <param name="exampleParam"> The example parameter. </param>
  ///
  /// <returns> true if the test passes, false if the test fails. </returns>
  ///------------------------------------------------------------------------------

User defined top/bottom separator lines
  /********************************************************************************/
  /// <summary> Tests skins. </summary>
  ///
  /// <remarks> Jason Williams, 23/04/2009. </remarks>
  ///
  /// <param name="exampleParam"> The example parameter. </param>
  ///
  /// <returns> true if the test passes, false if the test fails. </returns>
  /********************************************************************************/

User-defined 3-line separator lines, using %type% and %name% to describe the code element in the top separator section. Lines are not prefixed.
  /**=================================================================================================
     Method: TestSkins
     =================================================================================================<summary>	Tests skins. </summary><remarks>	Jason Williams, 28/10/2009. </remarks><param name="exampleParam">	The example parameter. </param><returns>	true if the test passes, false if the test fails. </returns>
     -----------------------------------------------------------------------------------------------*/

User defined top/bottom separators, no line prefixes
  /**<summary> Tests skins. </summary><remarks> Jason Williams, 23/04/2009. </remarks><param name="exampleParam"> The example parameter. </param><returns> true if the test passes, false if the test fails. </returns>
  **/

User defined multi-line top/bottom separators, no line prefixes
  //============================== Corporation XYZ ================================
  /**<summary> Tests skins. </summary><remarks> Jason Williams, 23/04/2009. </remarks><param name="exampleParam"> The example parameter. </param><returns> true if the test passes, false if the test fails. </returns>
  */
  //-------------------------------------------------------------------------------

User defined top/bottom separators and line prefixes
  /**
    * <summary> Tests skins. </summary>
    * 
    * <remarks> Jason Williams, 23/04/2009. </remarks>
    * 
    * <param name="exampleParam"> The example parameter. </param>
    * 
    * <returns> true if the test passes, false if the test fails. </returns>
    *****************************************************************************/

User defined top/bottom separators, no line prefixes
  #region Header
  /**<summary> Tests skins. </summary><remarks> Jason Williams, 23/04/2009. </remarks><param name="exampleParam"> The example parameter. </param><returns> true if the test passes, false if the test fails. </returns>
  **/
  #endregion

They don't even need to be comments as long as you can get the compiler to ignore them!
  #if false<summary> Tests skins. </summary><remarks> Jason Williams, 23/04/2009. </remarks><param name="exampleParam"> The example parameter. </param><returns> true if the test passes, false if the test fails. </returns>
  #endif

Custom element ordering, remarks removed
  ////////////////////////////////////////////////////////////////////////////////////////////////////
  /// <param name="exampleParam"> The example parameter. </param>
  ///
  /// <returns> true if the test passes, false if the test fails. </returns>
  ///
  /// <summary> Tests skins. </summary>
  ////////////////////////////////////////////////////////////////////////////////////////////////////

Custom text (and variable expansion) in remarks element...
  ...
  /// <remarks> Created: 1:34pm, 23 April 2009 by Jason Williams on JasonW-PC01. </remarks>
  ...

...remarks section replaced entirely with custom XML elements for author/date.
  ...
  /// <author>  Jason Williams </author>
  /// <date>    23/04/2009 </date>
  ...

Automatic insertion of default TODO tags to remind developers to complete the comment.
(Compatible with Visual Studio's Task List window).
  /// <remarks>
  ///     TODO: Fill in the remarks
  /// </remarks>


Entry Formatting examples

The entry formatting preferences control how each entry is formatted within the comment structures. Similar settings are available for Doxygen/Qt/JavaDoc comments. The examples below show just a few of the hundreds of formatting styles that can be achieved.

Symmetrical Tags, Indented Text
  ////////////////////////////////////////////////////////////////////////////////////////////////////
  /// <summary>
  ///     This example illustrates how documentation entries can be auto-formatted by
  ///     AtomineerUtils. The formatting options allow you to choose an ideal compromise between
  ///     readability and compactness.
  /// </summary>
  ////////////////////////////////////////////////////////////////////////////////////////////////////

Symmetrical Tags, Left-Aligned Text
  ////////////////////////////////////////////////////////////////////////////////////////////////////
  /// <summary>
  /// This example illustrates how documentation entries can be auto-formatted by AtomineerUtils. The
  /// formatting options allow you to choose an ideal compromise between readability and compactness.
  /// </summary>
  ////////////////////////////////////////////////////////////////////////////////////////////////////

Tabular Text (inline end tag)
  ////////////////////////////////////////////////////////////////////////////////////////////////////
  /// <summary> This example illustrates how documentation entries can be auto-formatted by
  ///           AtomineerUtils. The formatting options allow you to choose an ideal compromise
  ///           between readability and compactness. </summary>
  ////////////////////////////////////////////////////////////////////////////////////////////////////

Flowing, indented text
  ////////////////////////////////////////////////////////////////////////////////////////////////////
  /// <summary> This example illustrates how documentation entries can be auto-formatted by
  ///    AtomineerUtils. The formatting options allow you to choose an ideal compromise between
  ///    readability and compactness. </summary>
  ////////////////////////////////////////////////////////////////////////////////////////////////////

Flowing, left-aligned text
  ////////////////////////////////////////////////////////////////////////////////////////////////////
  /// <summary> This example illustrates how documentation entries can be auto-formatted by
  /// AtomineerUtils. The formatting options allow you to choose an ideal compromise between
  /// readability and compactness. </summary>
  ////////////////////////////////////////////////////////////////////////////////////////////////////

Tabular text (end tag on new line)
  ////////////////////////////////////////////////////////////////////////////////////////////////////
  /// <summary> This example illustrates how documentation entries can be auto-formatted by
  ///           AtomineerUtils. The formatting options allow you to choose an ideal compromise
  ///           between readability and compactness.
  ///           </summary>
  ////////////////////////////////////////////////////////////////////////////////////////////////////

Flowing, indented text (end tag on new line)
  ////////////////////////////////////////////////////////////////////////////////////////////////////
  /// <summary> This example illustrates how documentation entries can be auto-formatted by
  ///    AtomineerUtils. The formatting options allow you to choose an ideal compromise between 
  ///    readability and compactness.
  ///    </summary>
  ////////////////////////////////////////////////////////////////////////////////////////////////////

Flowing, left-aligned text (end tag on new line)
  ////////////////////////////////////////////////////////////////////////////////////////////////////
  /// <summary> This example illustrates how documentation entries can be auto-formatted by
  /// AtomineerUtils. The formatting options allow you to choose an ideal compromise between 
  /// readability and compactness.
  /// </summary>
  ////////////////////////////////////////////////////////////////////////////////////////////////////


File Headers

DocXml doesn't directly support file headers. For this reason, Atomineer supports both XML-based and plain-text file header comments. Both styles are configurable within the Block Templates, and can be populated using variables such as %fileDescription%, %user%, %copyright% and %filename% to fill in context-specific details. Below are some examples:

Default Atomineer file header
(plain text)
  ////////////////////////////////////////////////////////////////////////////////////////////////////
  // file:      AtomineerUtils\CustomerBookingDlg.cs
  //
  // summary:   Implements the customer booking Dialog
  ////////////////////////////////////////////////////////////////////////////////////////////////////

More comprehensive plain-text example
  ////////////////////////////////////////////////////////////////////////////////////////////////////
  // project:   Flight Booking System
  // file:      AtomineerUtils\CustomerBookingDlg.cs
  //
  // summary:   Implements the customer booking Dialog
  //
  //            Copyright (c) 2009 atomineer.com. All rights reserved.
  //
  //            Date         Developer         Change
  //            13/06/2009   Jason Williams    Created
  ////////////////////////////////////////////////////////////////////////////////////////////////////

XML equivalent of the default file header.
  ////////////////////////////////////////////////////////////////////////////////////////////////////
  /// <file> AtomineerUtils\CustomerBookingDlg.cs. </file>
  /// 
  /// <summary> Implements the customer booking Dialog. </summary>
  ////////////////////////////////////////////////////////////////////////////////////////////////////


Doxygen, Qt and JavaDoc

The Atomineer support for Doxygen, Qt and JavaDoc formats is just as configurable as for Documentation Xml, so most of the above examples can be achieved while using Doxygen/Qt/JavaDoc markup. There are also some Doxygen-specific options. Some examples are:

The default Doxygen (Qt) style
  ////////////////////////////////////////////////////////////////////////////////////////////////////
  /// \fn bool SkinTest(int exampleParam)
  ///
  /// \brief  Tests skins.
  ///
  /// \author Jason Williams
  /// \date   23/04/2009
  ///
  /// \param  exampleParam   The example parameter.
  ///
  /// \return true if the test passes, false if the test fails.
  ////////////////////////////////////////////////////////////////////////////////////////////////////

Doxygen (JavaDoc) style
(@ command prefix)
  ////////////////////////////////////////////////////////////////////////////////////////////////////
  /// @fn bool SkinTest(int exampleParam)
  ///
  /// @brief  Tests skins.
  ///
  /// @author Jason Williams
  /// @date   23/04/2009
  ///
  /// @param  exampleParam   The example parameter.
  ///
  /// @return true if the test passes, false if the test fails.
  ////////////////////////////////////////////////////////////////////////////////////////////////////

Doxygen (Qt) without the code-element declaration entry
  ////////////////////////////////////////////////////////////////////////////////////////////////////
  /// \brief  Tests skins.
  ///
  /// \author Jason Williams
  /// \date   23/04/2009
  ///
  /// \param  exampleParam   The example parameter.
  ///
  /// \return true if the test passes, false if the test fails.
  ////////////////////////////////////////////////////////////////////////////////////////////////////

JavaDoc AutoBrief style (no tag on the 'brief' entry), within a block comment
  /**
    * Tests skins.
    *
    * @author Jason Williams
    * @date   23/04/2009
    *
    * @param  exampleParam   The example parameter.
    *
    * @return true if the test passes, false if the test fails.
    */

Alternative block style
  /*!
      \brief  Tests skins.
      \param  exampleParam   The example parameter.
      \return true if the test passes, false if the test fails.

      \author Jason Williams
      \date   23/04/2009
  */

Alternative block style
  /**
      @brief  Tests skins.
      @param  exampleParam   The example parameter.      
      @return true if the test passes, false if the test fails.

      @author Jason Williams
      @date   23/04/2009
  */

Compact block style
  /// \fn bool SkinTest(int exampleParam)
  /// \brief  Tests skins.
  /// \author Jason Williams
  /// \date   23/04/2009
  /// \param  exampleParam   The example parameter.
  /// \return true if the test passes, false if the test fails.

Viewing all 226 articles
Browse latest View live


Latest Images