Quantcast
Channel: arduino for visual studio
Viewing all 226 articles
Browse latest View live

How to fix android build.xml errors in processing 1.5>2.0 beta

$
0
0

Updated 05 November 2011

This issue will shortly be resolved by Processing 2.0 alpha 3

http://code.google.com/p/processing/downloads/list

The following information applies only to earlier processing builds to Processing 2.0 alpha 3 and should be ignored

The following solution worked for some of us but might not be what is required by others.

Some people have reported this solution works for them, others have complained angrily that this did not help them. If you are someone who can't be bothered to read instructions or you are a person who complains when given something for free that doesn't work, then close your browser now.

There are a few problems in as much as the ant system has changed in 14 which means that processing.org and all other android apps that use ant will now fail. To make matters worse the android sdk download repository format has changed so you can't use an older sdk manager to download older api sources (such as 7 & 8).

If, like me, you don't need the versioin 14 api then you can get processing working on windows as follows:-

1) Download android sdk 14. You have no choice!

NOTE: I had problems with the android sdk when installed into "Program Files" bacuase of the space in the folder name. I used "c:\android\android-sdk" in the end

2) When the android sdk manager runs, de-select everything
3) Select and download version 7 & 8 api along with associated google api
4) Follow the processing android instructions for enviroment variables
5) Finally, install r12
over the top using one of these google links

  1. http://dl.google.com/android/android-sdk_r12-windows.zip
  2. http://dl.google.com/android/android-sdk_r12-mac_x86.zip
  3. http://dl.google.com/android/android-sdk_r12-linux_x86.tgz
  4. http://dl.google.com/android/installer_r12-windows.exe

You end up with api versions 7&8 installed using sdk manager v14 but you will be running with sdk manager v12. If you already have 14 installed along with the 7&8 api then just install r12 and set the enviroment variables.

 A few people have asked about the enviroment variables. This is how mine are set :-

 1) I don't know if these are required, I ran out of testing time. On my test machine the android sdk is installed in C:\Android\android-sdk. I have appended the following syntax to my path user variable.

 ;C:\Android\android-sdk\tools;C:\Android\android-sdk

 2) I added a System variable called ANDROID_SDK and set its value to C:\Android\android-sdk


How to add an Arduino library using Visual Studio

$
0
0
Add an arduino Library using the project menu
The 2nd entry on the Project menu allows libraries to be added
 
When adding libraries the #includes are automatically added to the master .pde source.
You must click "Save" before the intellisense will detect the new libraries.
 
Optionally toggle the library sources in/out of the visual studio project using "Project>Show all Arduino files".
Including the actual library sources codes does not break the compiler but allows the libraries to be explored using the Visual Studio object browser

Microsoft Visual Studio 2010 Free for 3 years?

$
0
0

Introduction

The Microsoft Web Site Spark program described below can take between 1 and 3 days to become active.

Should you want to start using Visual Studio Professional today on a 90 day trial then you can do so using on microsoft.com.

The trial download is a full version of Visual Studio Professional allowing you to update the product key license for up to 3 years after registering for the Microsoft Web Site Spark offer.

To get the longest possible use of Visual Studio you might want to consider delaying your web site spark sign up for a couple of months and enjoy the free 90 day trial for a while Wink

After submitting your application to Microsoft, Microsoft will allocate you a subscription id. The id can be seen immediately but can take a few days to become active.

If you do not have any keys under MY PRODUCT KEYS within 3 days then follow the instructions using the "My Account" option in your Web Site Spark control panel to notify Microsoft of the problem.

You have three choices of sign up:-


The remainder of this document explains Web Site Spark, in a little more detail

When filling in the Microsoft Application remember that you do not have to lie. You do not have a company name so enter your own name in the company name questions, number of employees is 1 because you are a private individual!

Again, when filling in your Microsoft application do not lie, you are a private individual which is allowed by the current rules. In the company description box enter something that describes how your mico-controller project could integrate with a web site. Here are some examples:- "Private individual specializing in microcontroller, monitoring and visualization", or "Remote robot controller" or "micro-controller gps location tracking" or "remote washing machine and oven controller" or "remote chicken coup monitoring" anything that might describe your Arduino project and how it might integrate with a web app that you might hope to build using visual studio and your free windows assure hosting benefits Laughing 

Please read the notes about annual renewal and self-certification at the end of this document

Description: http://www.visualmicro.com/image.axd?picture=2011%2f10%2fWebSiteSparkMsdn.PNG

About this Microsoft Offer

This information is provided without guarantee or warranty.

Private individuals, might find that the Microsoft Web Site Spark program provides many free and interesting benefits for a period of 3 years. This document describes my observations about the sign up process for the web site spark program.


Web Site Spark Program Features and Membership Requirements


Some of the free benefits include:-

  • Microsoft Visual Studio Professional
  • Microsoft Web Development Tools
  • Microsoft Sql Server
  • Microsoft Windows Azure Hosting (Up to $1400 worth Wink)
  • Free Microsoft Training and Technical Support

What the Microsoft Sign Up and Application Form Looks Like On September 2012


You should be starting with this page for the sign up process. It should look like this.
The application page should be here and look like this

Description: http://www.visualmicro.com/image.axd?picture=2011%2f10%2fWebSiteSparkMsdn.PNG

The web site spark program can help you build a career (or business) that provides web development services. The program is free to join and provides 3 year licences for Microsoft Visual Studio Professional and other useful software.

In Arduino terms we can use Visual Studio to build Arduino programs and also to build remote web based telemetry, monitoring and control system programs. This makes this bundle exciting to me and also allows for the possibility to bridge a hobby and a career.

Currently, you should be aware that Microsoft have the right to cancel your subscription with 60 days notice and request that you stop using the free software if they feel you do not comply to their rules for joining the program.

Microsoft retains full discretion to assess whether a given application created by a Web Pro satisfies their eligibility rules which are not set in stone and can be changed by Microsoft whenever they like. I guess that if the rules are changed or you do not comply you might still expect 60 days notice before you must stop using the software?

When completing the web site spark application form I found NO NEED to lie. The application form is a bit confusing because it asks about your company. You do NOT have to own or be working for a company to sign up. Read more...

  • In the "number of employees" question enter "1", in the "company description" box enter "Private Individual" or something like the suggestions at the top of this document and enter your name in the company name box.

Alternatively in the "Company Description" box, enter something like this "Private Individual Seeking to use Visual Studio to join Arduino to the Web and become as Rich as Bill Gates used to be" Smile

When/if your subscription is activated you will see a list under "GET SOFTWARE" > "MY PRODUCT KEYS" and in the "DOWNLOADS" area.

Tip: After you have subscribed, your subscriber downloads will always be available on Microsoft developer network http://www.msdn.com. Use the same Microsoft id to logon to msdn that you use to logon to web site sparks.

Once you have signed up you will see a big button allowing you to access downloads GET SOFTWARE. The big button (see image above) actually logs you into to the Microsoft developer network (msdn) and looks like the following image.

Clicking the GET SOFTWARE button will take you to http://www.msd.com which you can see in the image below (as of Sept 2012)

Description: http://www.visualmicro.com/image.axd?picture=2011%2f11%2fMsdn+download+example.PNG

If possible, use the Web Download option because it is simpler. Otherwise, to the right of each "download link" is a link that will show your personal license key for the selected product (keep it private)http://www.microsoft.com/websitespark/

As an alternative, after you have signed up for websitespark, you can logon directly to msdn http://msdn.microsoft.com/en-us.

In Summary

To me, this seems like a great offer from Microsoft that might help many other budding developers develop their new careers into something special. I can't say if you should or should not take advantage of this offer but it is well worth consideration and it is hard to see a down side.

More Web Site Spark Reading

When you join Microsoft Web Site Spark you will accept their terms and conditions. After 12 months (or at any time) Microsoft can ask you to renew your subscription and your copy of Visual Studio can revalidate the license key at any time. You might find it easy to renew your subscription, I did, but if not then keep in mind the free 12 month offer for windows azzue + up to $1400 of azzure services for free.

Yearly Microsoft Partner Network Subscription Renewal

Renewal of your subscription for the microsoft partner network is quite easy when you bear in mind the huge variety of applications we can create with Visual Studio and our Arduino projects. You will be emailed by microsoft requesting you renew your subscription. Clikcing renew will normally just ask you to update your details and pick from lists of choices.

Should you need to create a web app at any time, you will find it quite easy to create small windows assure programs with the Web Site Spark tools, tutorials and free assure services. Your windows assure hosted solutions can be as simple or as powerful as you or you like and when you have created an app you might enjoy turing it into a small business by allowing other arduino users to pay a small amount for use of your assure hosted system. A business does have to be sucessful to be a business, so this free offer is a great way to try a few ideas that might or might not lead to some additional income.

It's all free so you might as well go for it and see what you can build with all these tools Cool Good luck!

How to use Visual Assist X to refractor Arduino source code

$
0
0
Visual Assist X by "Whole Tomatoe Software" is, amonst other things, a very good refractoring and code highlite tool. It is not free, a hobby licence costs $100 and is update proof for 6 months.
 
I would not normally suggest an addin for Visual Studio, let alone one you pay for, because they all slow things down. However the Visual Assist X (VAX) tool is so well used and well written that it is worth trying it out.
Below you will find a brief overview of the VAX tool along with instructions about how to configure arduino .pde and .ino files as c++ files in VAX

Develop new code faster with fewer errors

Read code faster than ever with fewer errors with enhanced syntax coloring. Write code at blinding speeds with Suggestions, Acronyms and Snippets. Identify and correct errors before compiling.

Quickly understand existing code

Enhanced IntelliSense and enhanced completion listboxes help to shed light on unfamiliar classes and members. Get detailed information on current symbols and quick shots of info by looking at small context and definition fields.

Refactor existing code making it easier to read and cheaper to maintain

Visual Assist X offers fast and easy refactoring across ALL languages in your solution with its suggested refactoring and code outline view. "I have to say that I like this feature the most. Highlite a chunk of code and have a method automatically created for you! A great way to re-structure code."

How to configure VAX to recognise .pde or .ino source files as c++ files

You have two options... 

If you have already setup visual studio color coding (as per Visual Micros Arduino guide) then you might only need to follow the instructions below. Otherwise follow the official whole tomatoe C/C++ setup guide. You need to configure for both .pde and .ino Arduino file extensions
Add ".pde;.ino;" to ExtSource in the following location
HKEY_CURRENT_USER\Software\Whole Tomato\Visual Assist X\VANet8

Press Rebuild on the Performance tab of the Visual Assist X options dialog and restart your IDE

NOTE:-
Replace 8.0 with 10.0 if you use VS 2010.
Replace 8.0 with 9.0 if you use VS 2008.
Replace 8.0 with 7.1 if you use VS.NET 2003.
Replace 8.0 with 7.0 if you use VS.NET 2002.

Replace VANet8 with VANet10 for Visual Studio 2010.
Replace VANet8 with VSNet9 if you use VS2008.
Replace VANet8 with VSNet if you use VS.NET 2003.
Replace VANet8 with VANet7.0 if you use VS.NET 2002

Arduno Debugger - Alpha Preview

$
0
0

This is an aplha preview of the first Arduino debugger that works like a real debugger. An Arduino debugger that can debug projects over any connection type such as Serial, Bluetooth, TCP/Net and Xbee.

Add breakpoints to any line of code and optionaly set a range of properties that enable conditional return of information to the Visual Studio debug listener. This solution removes the need to add debug code to arduino source files and works seemlessly alongside normal serial transmissions.

There are many features that will be documented shortly, but a crude example of some features is pictured below. It is not the best screen shot, the trace doesn't reflect the serial viewer because the view is scrolled for the example


In the example the sketch has "i" as an accumlated sum of Serial.bytesAvailable() and millis() being used both conditionally and as data passed back to Visual Studio. A snippet of arduino code can be entered as a condition or a simple variable (as shown above).

The example shows that some breakpoints are configured to show messages that include {variables} $specialFields allowing quite complex messages to be created very easily.

The variables in the "Variables" window are automatically deduced from the {variables} defined in breakpoint "When Hit". If only {variables} are entered into the "When hit" then no message is produced but we still see an update to the variables window. The number of times a variable has been hit is also recorded. Nb: The variables window will be extended to include details of the function the variable relates to.

Summary

Variables and/or messages are optionally sent from the arduino simply by altering the properties of each breakpoint. Code comparison/conditions and hit counter measurement are an example of features that enable us to control the frequency of individual debugger updates. Only the variable data is sent from the arduino, all other message text is outputed by Visual Studio.

A standalone version of the debugger and serial tools will also be released but later this year. The standalone version will be a simple application that allows arduino projects to be compiled in debug or release modes and to enable breakpoints to be configured. This means that the debug tools will be available to use alongside other arduino IDEs. There is no reason why the tool will not be "mono" compatible, allowing other non-windows platforms to benefit

This arduino debug solution is simple enough to operate over wireless such as xbee and can be used in conjunction with wired (or wireless) arduino programming

This tool will be a low price but chargable upgrade to the free Visual Studio IDE Plugin

A Practical Arduino Debugger - Simple, Flexible and Very Powerful

$
0
0

The Arduino hardware is great hardware but has always lacked the facility to debug. Visual Micro has released this unique usb debugging tool for Arduino. The tool automatically combines the debug facilities of Visual Studio, a world class IDE, with simple Arduino usb/serial commands without altering any of your Arduino source code. 

The debugging tool was first announced in May 2012 and since then, thanks to an army of beta testers, has matured to a highly stable state. The tool will cost between $29 and $49 and is an upgrade for the free Arduino plugin for Visual Studio

Free licences are being given to anyone who would like to test the tool. To obtain a free licence, join the visualmicro.com forum including a request for the debug tool. (if already a forum member then pm or email us). Offer ends January 30 2013

This integrated software debugger is not the same as a full hardware debugger. It can not be relied upon for use with sensitive and dangerous projects. However it is an easier to use "real world" alternative and contains more productivity features. Requires a usb connection and an Arduino

WikiForum, Watch a YouTube tutorial movie of the plugin and the Arduino debugger This (25 min) video demonstrates first time use of both Visual Micro and the Debug Tools.
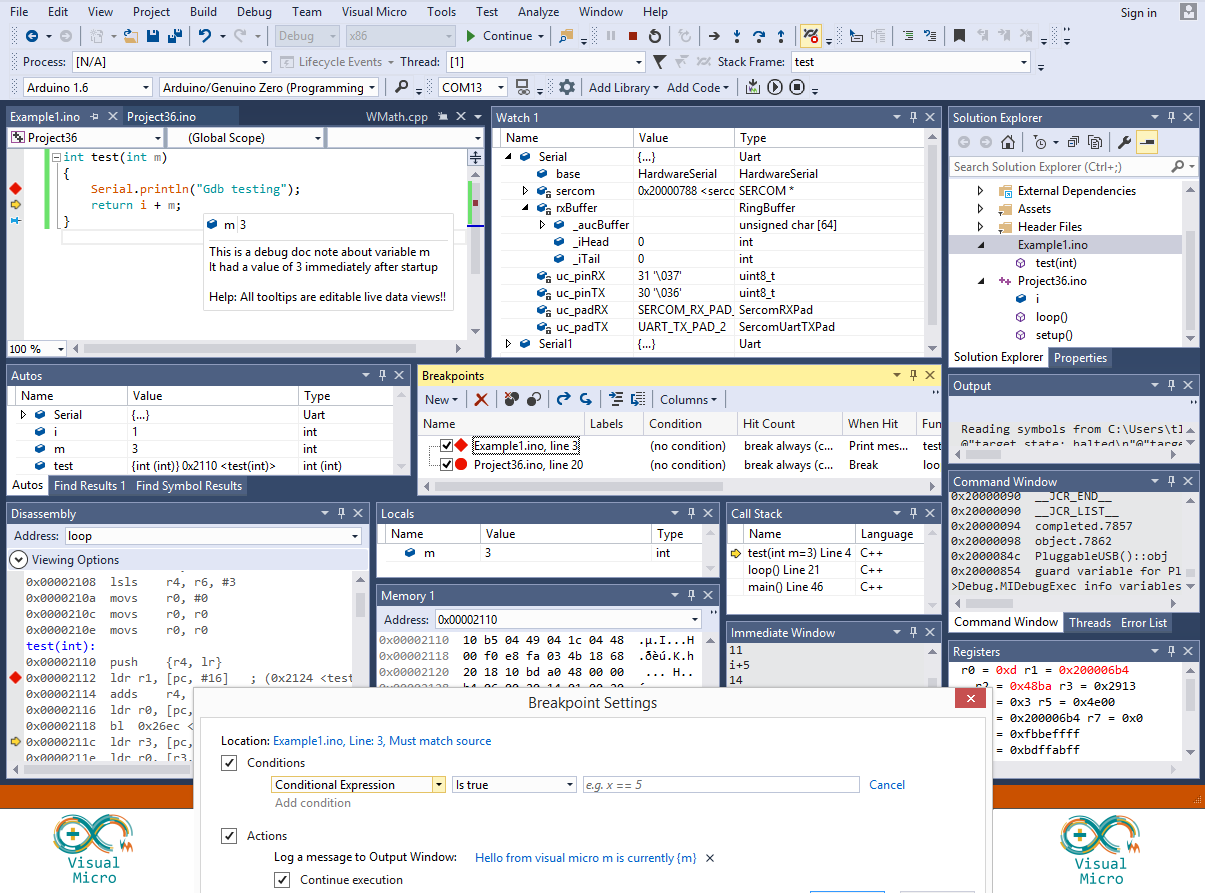
Update Arduino MCU Variables During A Debug Session

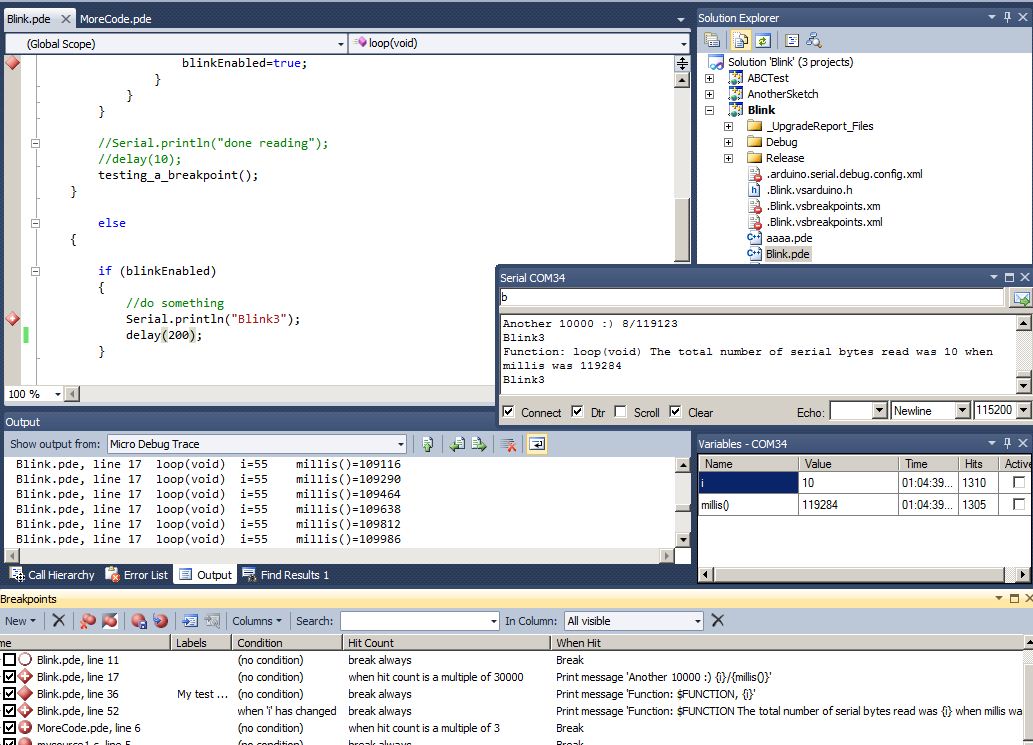
note: Click the image for more details. The message viewer in the image above was frozen at an informative position for the purposes of the example. Yes the code in the example is rubbish and doesn't do anything useful. It's an example!

Overview

Most programmers are used to adding breakpoints to lines of code with the facility to inspect expressions in real-time. This debug upgrade for the Visual Studio plugin provides this facility.

To debug Arduino, most programmers resort to sending text messages from an Arduino to the pc containing the information they are trying to view or debug. This results in scattering the real code with additional debug commands, makes the code difficult to read and consumes siginificant amounts of Arduino memory.

In most other, non-arduino applications debugging is achieved by clicking source code to add breakpoints or tracepoints. Breakpoints provide the facility to watch expresion values, provide textual messages about the current state of a running program and cause a program to pause/wait for user command to continue. Tracepoints provide the same information of a Breakpoint but without causing the micro-controller to pause.

The image above shows a running Arduino debug session in addition to the latest feature of allowing Arduino variables to be changed during debug. The arduino code (bad example) shown below is the entire arduino program source.

In the picture above all of the variables have different values to the defined source code. This is because the variables have been altered using the "watch expressions" window.  The image also shows the message trace which is one of the 3 available trace windows provided by the debugger.

The text messages assigned in breakpoints are not stored on the Arduino so they can be as long as is needed without concern of excessive Arduino memory usage.

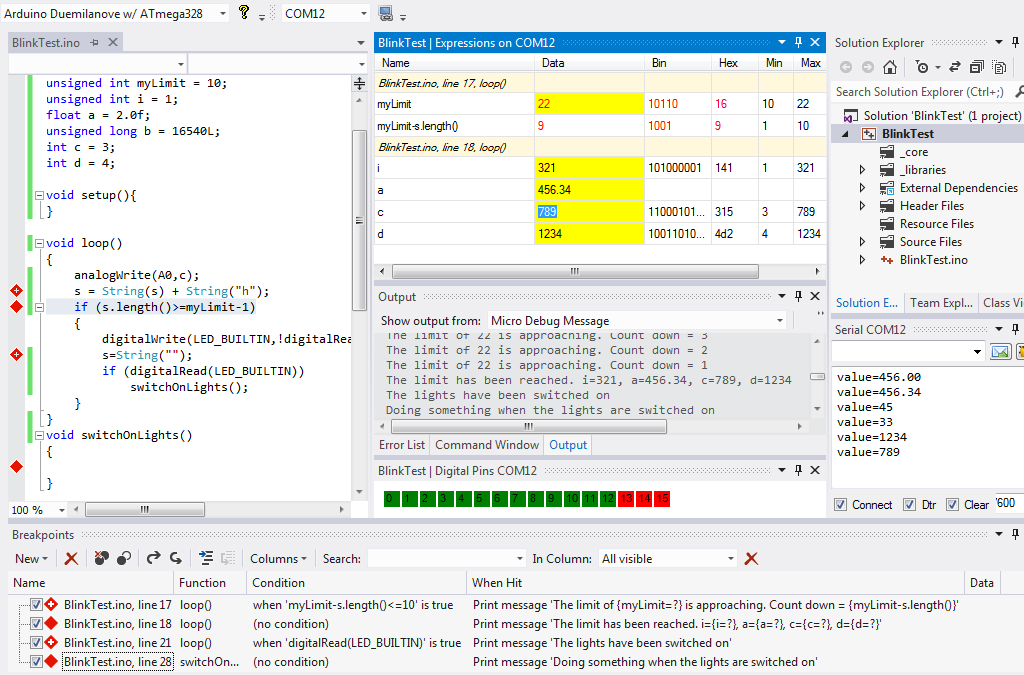
In the breakpoint configuration list it is possible to see how breakpoint messages are constructed and that they can consist of a mix of text and expressions. Any arduino variables and expressions can be used in breakpoints. Variables and expressions in breakpoints are automatically made available in the expression watch window grouped by breakpoint.

The expression watch window provides a number of additional options covered in detail in the wiki. Breakpoints in the expressions watch window also provide a tool tip showing useful configuration and original source code.

During a debug session normal arduino serial messages and variable update confirmation messages will be displayed in the serial monitor that is attached to the debug session (see image above "Serial COM12").

Improves Productivity - Works over usb, xbee, bluetooth and more

Developing small and large Arduino projects often depends on scanning the web to find the ranges of values produced by various sensors such as giro, temperature, acceleromoeter etc. The debug tool provides this information and also shows min and max values for every watched expression which makes it easier to see how sensors are working.

The debug tool has a huge array of options, the default settings are configured for new users allowing little or zero Arduino knowledge prior to staring a debug session.

The debug tool requires only a USB connection to work and also supports SoftwareSerial (used if the main arduino usb is being used for other purposes). A great benefit of using a simple serial transport for debug data is that it wil also work over GPRS and Radio such as XBee.

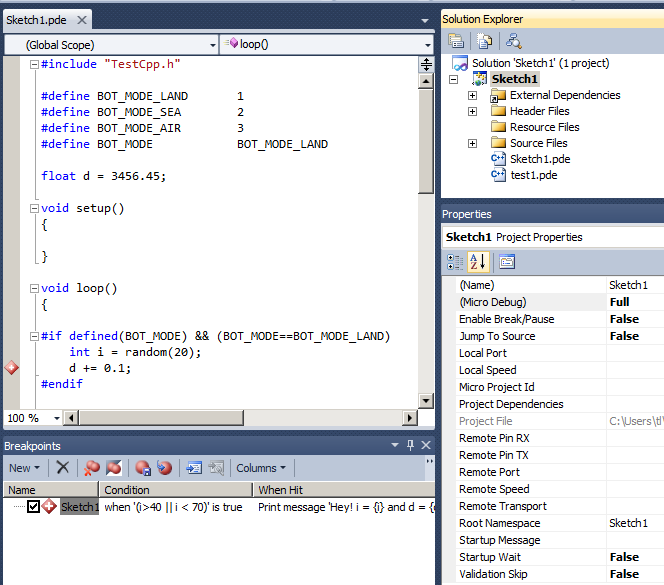
Conditional Breakpoints - Right click breakpoint context menu

The image below shows the context menu that appears when right mouse clicking an Arduino breakpoint in Visual Studio 2010

For the remainer of this document we will use the term "Breakpoint" meaning breakpoint or tracepoint.

Breakpoints are more effective when they are made conditional by the use of additional code such as if (x>100) or (HitCounter>10) or (TimeSinceLast>100ms) etc. Experienced pogrammers will be used to this type of conditional exception reporting but in normal Arduino programming this means surrounding the textual debug messages with additonal code. This means editing the Arduino program source every time the conditions or debug messages need to be modified. It's slow messy work which causes development to take much longer than it should.

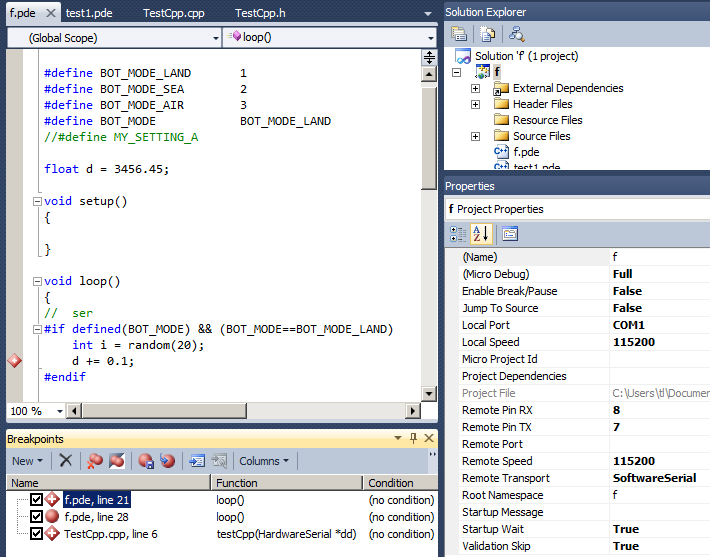
The image below shows a simple conditional Arduino breakpoint testing the value of variable "i" within a range between 1001 and 1499

Messages and Variable/Expression Watch - Replace those old arduino serial print() debug statements!

For non-arduino programs, Microsoft Visual Studio includes very easy to use and feature rich interfaces that enable programmers to set breakpoints, conditions, and many other settings. The ideal debug solution for Arduino would be to allow these standard debug features of Visual Studio to be used within an Arduino project. 

The debug facility from Visual Micro does just that. It enables programmers to configure debugging of an Arduino program in the same way a windows program can be debugged. The difference is that Visual Micro interprets the debug commands into Arduino source code dynamically when a programmer decides to upload a debug version of an Arduino program to an Arduino micro-controller. This happens seemlessly in the background and well away from the real code leaving the original Arduino program in a clean and untouched state.

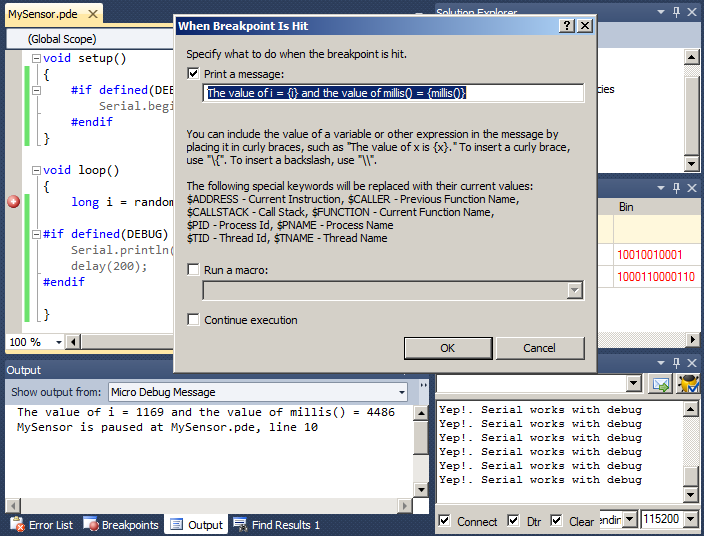
The image below demonstrates how to create an Arduino debug trace message combined with expressions in curly braces. The expression values will also be available in the expression watch debug window.

This example shows a few of the options that allow Arduino source code debugging

In theory, by injecting these additional commands into Arduino code we use additional memory that a normal running Arduino program does not use. However the Visual Micro debug tool does not compile string messages onto the Arduino, instead it retains the messages on the pc and displays them in the debug trace windows at the appropriate times. This results in smaller debug versions of Arduino programs than might normally be achieved with the "old style" Arduino debug facilities.

Feed back from users about the new debugger has been excellent so far. It seems to make Arduino development much easier for both new and experienced users. The result being faster production of working code and successful completion or all types of Arduino project in vastyly reduced time-scales. Less hair loss and head scratching!

Watch the Values of Variables and Expressions

As standard the debug tool is able to track complex Arduino expression values with options to see Min,Max,Hex,Binary representatiosn of all debug data. In addition to the standard debug trace and expression viewers the debug tool provides graphical visualizations or Analog and Digital pin values along with free memory graphs. The visualizations provided by the debugger are open source, can be altered to represent any data that is being processed on an Arduino.

The image below shows some of the options available in the Arduino expression watch window.

Hit Counters

An alternative to conditional breakpoints or code conditions is to use the "Hit Count" facility of a breakpoint. By default we can set the number of times a breakpoint is reached before the breakpoint is activated. Example: Activate a breakpoint after 200 hits or every 200 hits etc.

In Arduino terms setting the number of hits might not be so useful because the number might be in the 10's or 100's of thousands. For this reason Visual Micro provides a project property called "Hit Frequency Type" that can be changed from "Count" to "Milliseconds". This change causes all hit counts of the current project to signify a timespan in milliseconds instead of a numeric count. The result in our example would be to activate a breakpoint after or every 200 milliseconds.

Flexibility and Considerations

The open source visualizations are also created using Microsoft Visual Studio and C#. Any .NET (windows) language can be used to create additonal debugger visualizations which are easily registered so that the debug tool knows about them. Visualizations can be global for all projects or local to a specific project, can open on demand or in reponse to certain expressions becoming available within a debug session.

The debugger is not a full hardware debugger, for example it is only possible to watch expression values of expressions that are registered when adding a breakpoint. Break/pause allows only to step between breakpoints and not each line of source between two breakpoints. It is however much easier to use than a hardware debugger and more flexible in terms of data visualization and conditional reporting.

The tool should not be used in dangerous situations without being fully aware of how it works and what possible problems might occurr. For example a breakpoint that pauses when a drone rolls past a given angle would cause the drone to crash. Obviously!!

A single Arduino Debug session can run for years - We can re-connect to an existing debug session at any time

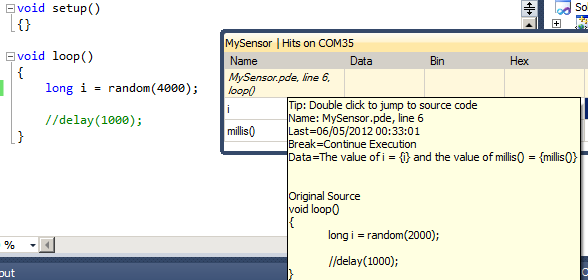
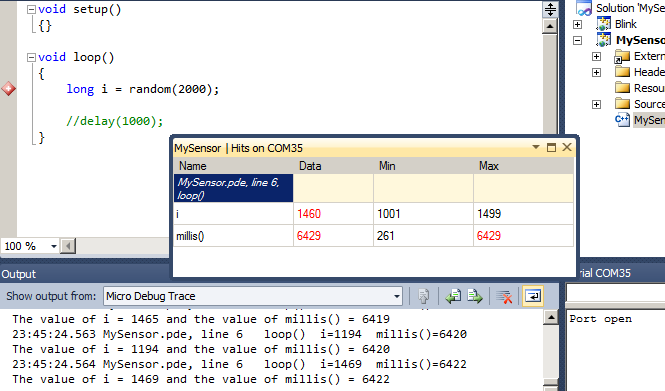
One other difference between normal windows application debug and the Arduino debugger is that the Arduino might be running for a significant time such as a month or year. As an example, this means that a debug condition on a remote weather sensor might not be hit for a year. In the meantime the original source code might have altered. Windows debugging does not cater for this situation but the Arduino debug does...

The image below shows how the debugger has retained knowledge of the code that is running on the Arduino, whilst the Visual Studio source code has been altered. You can see that the Arduino is producing a random number between 0 and 2000 whilst the code has been altered to produce a random number between 0 and 4000.

Sit Back And Watch Your Program Running

The debugger currently supports two modes. Continuous operation and/or ability to break/pause at certain points in an Arduino program. Both modes allow trace, messages and variables/expression watch. 

Break/pause mode allows stepping from breakpoint to breakpoint, unlike a hardware debugger that allows stepping through every code line. An example of break/pause might be a breakpoint on a line or code that only executes when a button connected to an arduino is pressed (pushed). In this case, when the button is pressed Visual Studio will open the source code containing the button click (if not already open) and highlight the line of code that has been reached.

When demonstrating code to other users, or to see the code of an arduino program that is unfamiliar, well placed breakpoints can be used to clearly show the flow of an arduino program. This is achieved by switching off break/pause and switching on "Debug>Breakpoint Manager>Jump To Tracepoints". ("Debug" is the little bug icon on the debugger serial window). With these settings applied, all breakpoints will not pause but the respective lines of source code will still be displayed and highlighted.

The result is the cursor will jump from code line to code line and/or source file to source file showing visually what arduino code is actually running at any moment in time. This feature is only useful with well spaced breakpoints that occur no more than a couple of times per second (depends on the speed of your computer)

Execution Speed

The default settings of the debugger are designed for new users and simple non-timing critical project debugging. This enables breakpoints to be used liberally in fast running loops althought this is not recommended. We have to keep in mind that the pc can only effectively process 10 or 20 debug messages per second yet in theory the Arduino could send 1000's per second. The debugger will automatically prevent the arduino from swamping the pc should the possibility arise as a result of breakpoint configuration/placement.

All debugger defaults can be overriden or disabled entirely by more expert users. However, if well placed conditional breakpoints are used, there should be no need.

Automated Analog, Digital and Memory Usage Visualizations

In addition to provding breakpoint/step/trace the debugger has a range of other features, some of which cause additional debug messages to be automatically generated,  such as Analog Pins Graph and Digital Pin Visualization.

This automated visualization of Arduino Analog and Digital pins can be achieved in two ways. Either by enabling "Micro Reports" in the Project properties or by adding special breakpoint "WhenHit" watch expressions such as {@ReportDigital} and/or {@ReportAnalog}. The breakpoint facility allows finer control over when visualization reports are generated, the automated version are generated at the start of each Arduino loop().

It is recommended that automatic reports are only used if there are no frequently execiting non-pausing breakpoints and that manual breakpoint reports are used, when required, at all other times.

Extensibility - Build/customize open source visualizations and plugins for the debugger

Click to enlarge. Soon to be released open source debugger visualizations. Digital and analog visualizations are included with the debugger upgrade

Arduino Debug Visual Studio 2010 The image below shows a running debug session in Visual Studio 2010 along with, breakpoint expression watch, open source graphical visualizations of Analog and Digital Pins + Custom Guages

Click to enlarge. Soon to be released open source debugger visualizations. Digital and analog visualizations are included with the debugger upgrade. Build visualizations using ANY data from an Arduino

View all arduino debugging tutorials. Email beta [at] visualmicro.com to obtain a free copy of the debug tool

References and Disclaimer

The standard plugin for Visual Studio was released in 2009 and has been updated constantly during since. The plugin provides 100% compatible programming and upload to any Arduino hardware. The plugin is used by thousands of people around the world.

New users should note that any type of debugging with a micro-controller can affect the speed at which the cpu (or connected hardware) operate and should not be used, or should be used carefully, for timer critical applications. This said, there are few applications that are timer critical so in the main, debugging is widely used.

This product is provided without warranty and is used entirely at your own risk. The same applies to the Arduino programs that this plugin and debug tool produce. No liability is implied or accepted for anything!

02 - Enable Arduino Debugging

$
0
0

Pre-release documentation for the debugger upgrade. Beta was released June 2012

In the debug enabled version of the Visual Studio plugin the project properties window can be used to set "per configuration" Arduino settings. To enable debug you do NOT need to add or alter any of your Arduino source code. ANY arduino project can be debugged.

"Per configuration" means that the settings are saved based upon the current Visual Studio configuration such as "Release" or "Debug". In the following example the configuration is set to "Debug"

After you have selected the configuration to be used for arduino debugging you should open the project properties window by clicking on the project name in the solution explorer and either pressing F4 or selecting the menu "View>Properties Window". You can see that one of the settings is "(Micro Debug)".

Set "(Micro Debug)" to "Full" to enable Arduino debugging.

The following default settings use the built in Arduino "Serial" port at 115200 and the projects local upload port/usb

The following example is using the default arduino software serial library.

Tip: The TX/RX pins in this example are the default so did not need to be entered. The same applies to the speed settings at 115200. To use the defaults you can simply set the transport to SoftwareSerial

Tips

Bear in mind that if you don't configure at least one source trace/break point(s) then you won't see very much in the trace other than an Arduino startup confirmation message.

To avoid confusion it is recommened that debug is enabled when Visual Studio is set to the "Debug" configuration. This then allows the configuration option to be used to quickly switch between a Release or Debug Arduino build and upload.

IMPORTANT WARNING - Enable Break/Pause causes the Arduino to STOP/WAIT when a breakable point in the source code is reached. You must only enable this option if you understand the consequences of the Arduino stopping and waiting for an F5 (continue) command. Further more, because the debug uses the serial port to communicate any transmission to the arduino serial port will cause the arduino to continue. REMOVE all propellers and consider the dangers of debug pause prior to using this feature! For this reason the default for this option is false (off) which forces all break points to become tracepoints regardless of their settings.

03 - Arduino Debugging Settings Explained

$
0
0

Pre-release documentation for the debugger upgrade. Beta was released June 2012

The project properties window is available when the project is selected in the Visual Studio solution explorer. Properties in the "Micro Debug" section are only used if (Micro Debug) is enabled (see the example below). The properties are the Arduino debugging options that are available.

IMPORTANT WARNING - Enable Break/Pause causes the Arduino to STOP/WAIT when a breakable point in the source code is reached. You must only enable this option if you understand the consequences of the Arduino stopping and waiting for an F5 (continue) command. Further more, because the debug uses the serial port to communicate any transmission to the arduino serial port will cause the arduino to continue. REMOVE all propellers and consider the dangers of debug pause prior to using this feature! For this reason the default for this option is false (off) which forces all break points to become tracepoints regardless of their settings.

Jump To Source is automatically enabled when a pausable breakpoint is hit. This option forces jumping to source for all tracepoints so must be used with consideration to how fast visual studio can react. For example if we only trace when a sensor button is clicked or when a condition happens infrequently (such as every 20 seconds or longer) then this option can provide a useful animated view of the code that is being executed.

Remote Port enabled us to override the serial port that the debugger uses. By default it uses the main Arduino Serial port and initialises the port speed to 115k. You may optional override the speed of the port or both the speed and the port. This option might be useful if you already use the main serial port or if you want to manually initialise the debug port in the sketch setup() function.

Startup Message provides the ability to send a startup message from the arduino when it is in debug mode

Startup Wait is used in cojuntion with Enable Break/Pause and automatically forces the arduino to wait for F5 (continue) when it starts or resets. The Startup message is displayed in the trace then the Arduino will pause

Tip: Press F4 or "View>Properties Window" if the debugging properties are not displayed. The visibility and position of the project properties will be remebered when you re-start Visual Studio


04 - Creating a Simple Arduino Debug Tracepoint

$
0
0

Pre-release documentation for the debugger upgrade. Beta was released June 2012

In this example we create a simple debug trace point using the main Arduino serial port and the default Visual Micro settings. This article assumes that arduino debugging in Visual Studio has been enabled (see this post for a how to).

The Visual Studio Debugger Breakpoints Window is opened using CTRL+ALT+B or by clicking the menu item Debug>Windows>Breakpoints. Alternatively you can right mouse click the tool bars and show the "Debug" bar as shown below above the source code.

In the example below the breakpoints window is displayed below the source code. A single breakpoint has been added by clicking the left margin of the source.

During compilation - How are breakpoints added to a temporary copy of the code?

During compilation, breakpoints are added to the end of the selected code line, can not be added to comment lines but can be added to empty source lines. Adding breakpoints to empty source lines is recommended because it ensures you are happy with the exact position the debug code will be added to a copy of the code. For example, consider the following line of code:-

if (foo) {a=0;}

In the above example the debug engine would compile the following code which involves a significant code change and might, in a more complex example, lead to unexpected results. The debug engine tries a few tests to attempt a code injection and might fail or produce the wrong code. Hence the rule, add breakpoints to empty or simple lines of codes.

if (foo)
{
a=0;
//some debug commands will be inserted here
}

SUGGESTION: Add debugger breakpoints to empty or simple lines of codes, see why at the end of this section

05 - Arduino Debug Basic Trace Point

$
0
0

Pre-release documentation for the debugger upgrade. Beta was released June 2012

When debuging has been enabled for a configuration a debug session can be started by pressing F5, clicking menu item "Debug>Start With Debugging" or the standard "Start Debugging" icon on the Visual Studio tool bar.

The first thing to note is that two compilations are performed. The first is normal compilation of the sketch to ensure it is free of errors then the second to include debug information. Below you can see the difference in memory between a release and debug build. The difference would be smaller if our test sketch already referenced the serial port and other basic arduino properties. Therefore this example probably represents a worst case senario.

If the serial port monitor was already open prior to upload then Visual Studio automatically displays the debug trace window. Otherwise the serial port monitor should be opened for the trace window to be displayed. The example below shows a running tracepoint. In a real world project we might have multiple break or trace points. Double clicking the trace point will jump to the correct line in the source code.

06 - Arduino Debugger Trace Messages and Variables/Expressions

$
0
0

Right mouse clicking a debugger break point in the source code or in the debugger Breakpoints Window (CTR+ALT+B) provides a number of menu items relevent to the breakpoint.


Clicking the debug "When Hit" option opens the following dialog window allowing us to optionally print a message that includes variable data or we can just report variables to the debug tool. Debugger messages can be as long as is needed because they are not compiled into the Arduino program. Messages are stored locally on the pc and displayed when a break or trace point is hit.

The example below shows how to create a dynamic trace message that includes variable data. Note that requests for variable data are enclosed in {brackets}. Any expression that returns a numeric (int, float etc) value is allowed and any number of expressions can be included in the message. The "Run Macro" option will be supported in future versions of Visual Micro. The "Continue Execution" feature is only relevent if "Debug Break/Pause" is enabled.

After making changes to arduino debugger breakpoints or source code the project must be compiled and uploaded. The easiest way is to press F5


If the debug message soley consists of expressions (no text) then a trace message entry is not displayed. The variable/expression inspector shown below will automatically open when a debug session starts.

Double click arduino debugger variables and/or trace message to jump to the respective source code line.


07 - Debug Arduino Conditonal Breakpoints and Tracepoints

$
0
0

If we need to debug fast running arduino code we might only want to trace exceptions or conditions within a certain range. Visual Micro allows any expression to be used as an arduino breakpoint condition.

To add a debug conditon to an arduino breakpoint we can use the right menu menu to select the breakpoint options menu. it is also possible to set a "Hit Count" allowing a tracepoint to be reported every x times that it is executed (hit) by the arduino cpu.

The example below shows an arduino debugger tracepoint that reports when a random number of between 0 and 2000 has a value between 1000 and 1500. The debugger tracepoint reports the value of i and also the value of the Arduino millis() (milliseconds since startup). "Is True" or "Has Changed" may be used to distinguish between the type of condition that is required. In each case the expression entered must either return boolean true/false or a value. The example below uses the "Is True" condition to ensure the value of i is within the given range.


The image below shows this conditional tracepoint when an arduino is running in debug mode. Notice the variables viewer displays both variable and expression along with min and max values. In the example below the min and max values of the condition have already been reached. 

Items in red show data that has changed since the last point was hit.

08 - Arduino Debugger Source Code Modification Tracking

$
0
0

Pre-release documentation for the debugger upgrade. Beta was released June 2012

A debug session continues on the Arduino until a release program/sketch version is upload therefore it is possible for the source code to be different from the source code running on the Arduino. For this reason breakpoint configuration and source code is saved during compilation and used to display messages and variable data during debug.

Tip: Hovering over the name of a breakpoint provides a summary of the code that was uploaded to the Arduino. In the example below we see that the Arduino is using a random number between 0 and 2000 when the code has been altered to between 0 and 4000


09 - Arduino Debugger Running Variables and Expressions Viewer

$
0
0

Pre-release documentation for the debugger upgrade. Beta was released June 2012

In addition to showing hit data the Variables and Expressions Window provides a number of additional columns that are enabled by right clicking the list (as shown below)

As with all Visual Micro windows the Variables Window can be docked. The windows position is retained on a port by port basis and scrolling locks the variables/expression name column to provide clearer analysis

During arduino program debug, variables and expressions are automatically displayed inside a grid grouped by breakpoint location. Double clicking a variable of breakpoint will jump to the respective line of source code

10 - Arduino Debugger Optional Message Viewers

$
0
0

Pre-release documentation for the debugger upgrade. Beta was released June 2012

Visual Studio provides a number of text message views during a arduino debug session. Configuration of which windows are used to view messages is available using the debug options sub menu on the active debugger Serial window as shown below.

Messages can be directed to any combination of 3 windows:-

  • Serial Viewer
  • Message Viewer
  • Trace Viewer

The example above would allow messages to be appear in a dedicated message window (as shown below) and also in the trace window (as shown in previous posts).

Below shows a "message only" window which is free of trace messages

Below shows a "trace only" window which is free of messages. The example below was created by unticking the "Trace" sub menu shown at the start of this post.


11 - Share The Arduino Serial Port With The Debugger

$
0
0

Pre-release documentation for the debugger upgrade. Beta was released June 2012

The example below shows a single Arduino Serial Port being used for both debug and static serial messages.

The example goes one step further by making use of the DEBUG symbol allowing the static messages to only be included in the program when debuging is enabled for the project.

Notes

In the example above the code in the Serial.begin() in the setup() function is not required because both the debugger and the project are using the same port. However, if the defined(DEBUG) condition is removed from the code then Serial.begin() would be required. Therefore it is safer to add Serial.begin() if your sketch code directly uses the Serial port.

The same would apply if the debug "Remote Port" on the project properties was set to a port other than "Serial". In this case you would certainly need to initialise the Serial port.

12 - Optionally make use of the _DEBUG symbol in your Arduino code

$
0
0

Nov 2012 - This document is out of date. A new prject property called Define _DEBUG allows you to enable this property in the standard plugin. The #define will be called _DEBUG

When debuging is enabled the _VMDEBUG symbol allows code to be used "instead of" or "in combination with" the Visual Studio debug tools

The example below shows the wrong name for this symbol


13 - Arduino Debug Break/Pause Into Source Code

$
0
0

Pre-release documentation for the debugger upgrade. Beta was released June 2012

The example below shows both automated and manual arduino source debugging features. The "old style" manual debug of arduino is shown in the code. Some of the automated features are shown in the "When Breakpoint hit" dialog

Individual points in your Arduino source code can be configured to break/pause or simply trace/continue without pause. The configuration settings change depending on the type of break or trace point. When a break/pause is hit Visual Studio will automatically open and select the line of arduino source that contains the current break point.

Most points can be configured to either continue or break/pause using the breakpoint message window as shown below.

Untick the "Continue Execution" checkbox to force a pause. Behind the dialog in the example we can see that the Arduino is paused on a breakpoint. Pressing F5, clicking any of the Visual Studio "Start>debug" commands or sending any serial data will re-start the Arduino program.

This example shows a few of the options that allow Arduino source code debugging

IMPORTANT WARNINGS! It is only right that we make the following statements very clearly...

Before enabling Arduino debug "break/pause" you must carefully consider what will happen if the Arduino suddenly stops on a breakpoint. Will your flying machine drop out of the sky and injure someone or be damaged. Will a robot crash? Will a motor be stuck on full power? Will a device stop responding and cause a critical problem? This is entirely your responsibility, if you are in any doubt then ask questions on the forum but please do not use this feature until there is no doubt! The same applies to the ability for the Arduino to pause at startup.

All arduino debug pause features provided in Visual Studio can not be relied upon in sensitive or dangerous siutations. This is because of the use of the serial port for the debug "continue" command. In the current version any data transmitted over the debug serial port will cause the Arduino to continue program execution which might be unexpected in many cases such as electrical interference and stray serial data.

Debug break/pause should only be used with breakpoints that will be hit every so often otherwise you will spend your time hitting F5 (continue) lots and lots of times :) If you mistakenly set a break condition that happens to often you will find that you can untick the "connect" checkbox on the serial window to stop the serial comms. This will, ineffect, stop the debug session but bear in mind that the Arduino will still be in debug mode.

Because the Arduino can be in debug mode and might be paused while Visual Studio is not in debug mode it is suggested that you either upload a "release" version when you finish debugging. This will ensure the Arduino is always in a known state. 

It is strongly recommended that you switch on the DTR setting on the serial window or in the Visual Micro options. The DTR setting will ensure that the Arduino is reset whenever  the serial window connects and/or debugging starts. Without the DTR setting it possible to start debuging when the Arduino is already paused on a beakpoint which will be confusing for most users.

Debug Break/Pause is enabled by selecting the project in the Solution Exporer and viewing the properties window (not right mouse click properties, the Property Window). Set Enable Break/Pause to True. Each time Break/Pause is enabled for a project a warning is displayed.


14 - Arduino Debug Hit Count Conditions

$
0
0

Pre-release documentation for the debugger upgrade. Beta was released June 2012

Instead of, or in combination with a conditonal breakpoint expression (as described in earlier posts) to make an Arduino trace or break point we can use the "Hit Count" dialog.

The hit count dialog is opened by right clicking any break break and selecting "Hit Count" from the menu that appears (described in detail in earlier posts). The Hit Count dialog allows us to select 4 options.

The example below is self explanatory. If we are adding a break point into a frequent arduino loop we might set a hit count of 30000.

Tip: The hit count is automatically combined with any conditional expression (as described in earlier posts). Example if an expression is true every second and we set a hit count of 30 then we would encounter a break or trace every 30 seconds.

A hit count will continue by default but can a cause break into source code. Please read the previous post for more information and important warnings about enabling breakpause with an arduino processor

15 - Arduino Debug Break Points Can Be Disabled But ...

$
0
0

Pre-release documentation for the debugger upgrade. Beta was released June 2012

You will notice that in Visual Studio breakpoints can be disabled. Visual Micro always sends all breakpoints to the Arduino during compilation but will stop reporting disabled breakpoints.

This means you can switch on/off breakpoints during a single debug session by enabling or disabling them.

If using debug break/pause with disabled breakpoints the breakpoint will still be active in the arduino but the pc will automatically send an F5. This means that disabled breakpoints will still cause the Arduino to work more slowly than normal but that the breakpoint will not require users to manually press F5. This feature might be useful in some situations or to freeze the variables window for certain variables.

It is recommended that breakpoints are exported and/or deleted when not being used.

Viewing all 226 articles
Browse latest View live


Latest Images